PROTECTED SOURCE SCRIPT
Price Percent Oscillator

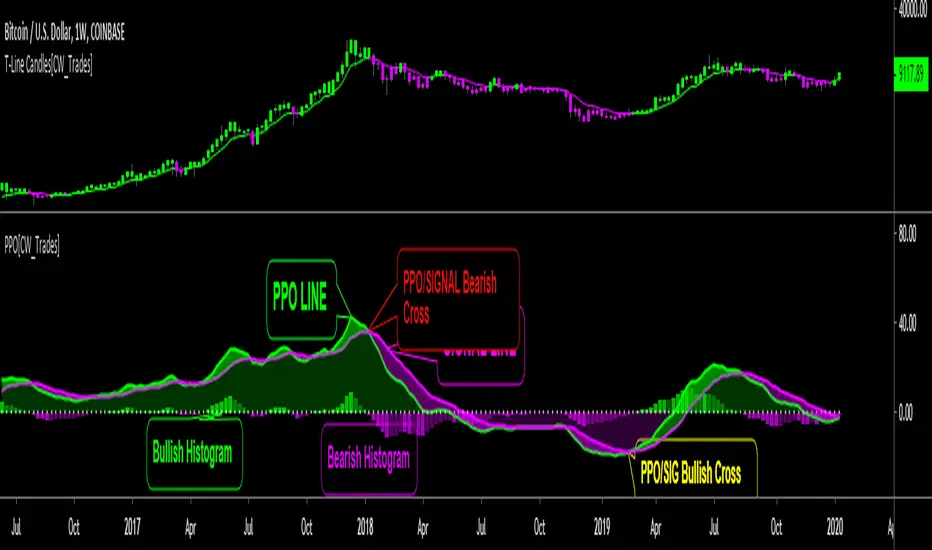
The Percentage Price Oscillator(PPO) is a momentum oscillator that measures the difference between two moving averages as a percentage of the larger moving average. Similar to the Moving Average Convergence/Divergence(MACD), the PPO is comprised of a signal line, a histogram and a centerline. Signals are generated with signal line crossovers, centerline crossovers, and divergences. Because these signals are no different than those associated with MACD, this indicator can be read exactly as the MACD is read. The main differences between the PPO and MACD are: 1) PPO readings are not subject to the price level of the security. 2) PPO readings for different securities can be compared, even when there are large differences in the price. MACD readings for different securities cannot be compared when there are large differences in price.
Calculations:
Percentage Price Oscillator (PPO): {(12-day EMA - 26-day EMA)/26-day EMA} x 100
Signal Line: 9-day EMA of PPO
PPO Histogram: PPO - Signal Line
This PPO indicator retains standard PPO settings. Additions to this indicator are: 1) filling the space between the PPO LINE and SIGNAL LINE. Space is green when PPO is above SIGNAL, purple when PPO is below SIGNAL. The color of the space between PPO and SIGNAL is used to define short-term momentum for price(green is positive momentum, pink is negative momentum). 2) filling the space between the PPO LINE and CENTER LINE(0 LEVEL). This space is filled green when the PPO is above the CENTER LINE and pink when the PPO is below the CENTER LINE. Green in this area indicates positive momentum in the intermediate-term while pink indicates negative momentum in the intermediate-term.
受保護腳本
此腳本以閉源形式發佈。 不過,您可以自由使用,沒有任何限制 — 點擊此處了解更多。
免責聲明
這些資訊和出版物並非旨在提供,也不構成TradingView提供或認可的任何形式的財務、投資、交易或其他類型的建議或推薦。請閱讀使用條款以了解更多資訊。
受保護腳本
此腳本以閉源形式發佈。 不過,您可以自由使用,沒有任何限制 — 點擊此處了解更多。
免責聲明
這些資訊和出版物並非旨在提供,也不構成TradingView提供或認可的任何形式的財務、投資、交易或其他類型的建議或推薦。請閱讀使用條款以了解更多資訊。