PROTECTED SOURCE SCRIPT
Opening Candle & Previous Day High and Low Levels
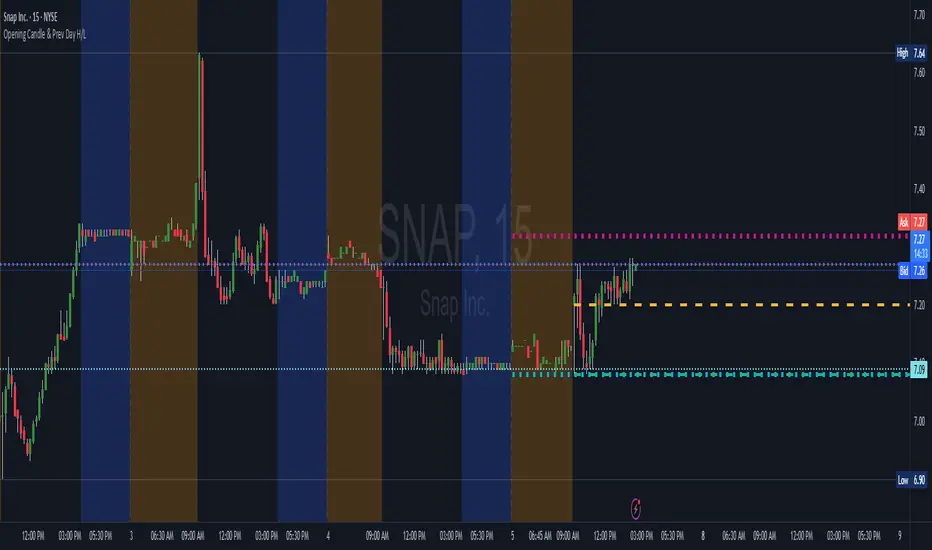
Opening Candle & Previous Day High/Low
This indicator automatically plots important reference levels that many traders use as key decision points:
Opening Candle High/Low
• Draws horizontal rays from the day’s opening candle (default 5-minute, adjustable).
• Choose between regular trading hours (09:30–16:00) or extended hours (pre/post-market).
• Fully customizable colors, styles, and widths.
Previous Day High/Low
• Marks the prior day’s high and low for easy reference.
• Works in both RTH-only or 24-hour session modes.
• Customizable styling for clarity on any chart.
Alerts
• Alerts can be triggered when price touches/crosses a level or comes near it.
• “Near” mode supports absolute points, percent of price, or ATR multiples.
• Users can monitor one specific line (Open High, Open Low, Prev High, Prev Low) or all levels together.
• Option to use intra-bar wick detection (immediate) or close-only confirmation.
Labels
• Optional price labels at the last bar, clearly identifying each active level.
-- How to Use It
TLDR: This indicator helps you track the opening range and the previous days highs/lows with alerts and automatically drawn & customizable lines. This is useful for intraday setups and swing strategies alike.
Day Trading:
• Opening range high/low helps spot early breakouts, breakdowns, and false moves. Good for positioning for Long or Short trades as well as SL areas.
• Prior day’s high/low often act as support/resistance zones where momentum stalls or accelerates.
• Alerts let you focus on scanning while the script tracks levels for you.
Large-Cap Swing Trading:
• Previous day’s high/low highlight areas institutions often defend or break through.
• Opening range levels provide short-term confirmation zones for swing entries.
• Monitoring how price reacts to these levels across multiple days can signal trend continuation or reversal on large-cap names.
受保護腳本
此腳本以閉源形式發佈。 不過,您可以自由使用,沒有任何限制 — 點擊此處了解更多。
免責聲明
這些資訊和出版物並非旨在提供,也不構成TradingView提供或認可的任何形式的財務、投資、交易或其他類型的建議或推薦。請閱讀使用條款以了解更多資訊。
免責聲明
這些資訊和出版物並非旨在提供,也不構成TradingView提供或認可的任何形式的財務、投資、交易或其他類型的建議或推薦。請閱讀使用條款以了解更多資訊。