OPEN-SOURCE SCRIPT
Don-x
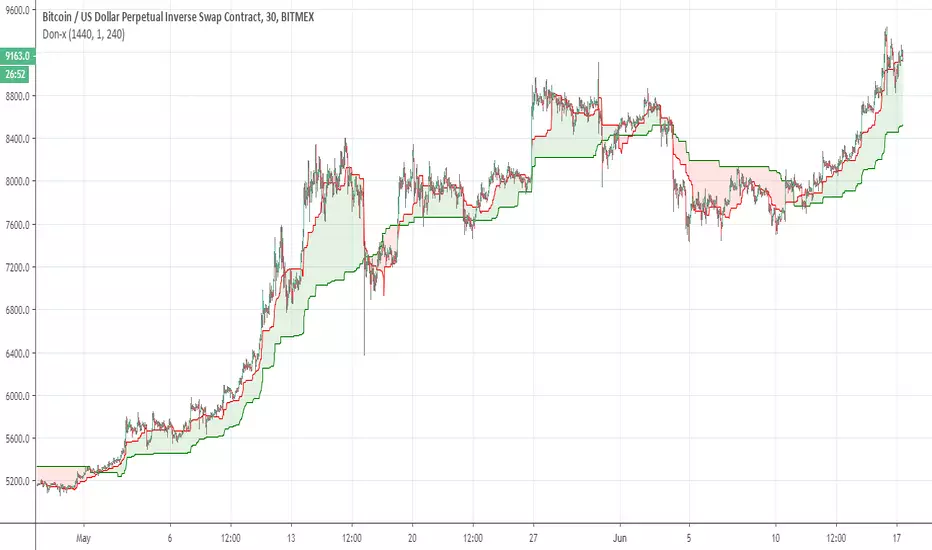
Simple indicator that nased on two donochian bases each calculated slight different with MTF , where we based a faster of 240 min over slower of daily one on each other and we put on lower time frame (30 min, 1 hour or 2 hour )
hence we can see the bullish trend (green ) or bearish trend (green ) more easy
can be used as by its own (slight lag ) or with other indicators to see where the asset direction is
hence we can see the bullish trend (green ) or bearish trend (green ) more easy
can be used as by its own (slight lag ) or with other indicators to see where the asset direction is
開源腳本
秉持TradingView一貫精神,這個腳本的創作者將其設為開源,以便交易者檢視並驗證其功能。向作者致敬!您可以免費使用此腳本,但請注意,重新發佈代碼需遵守我們的社群規範。
免責聲明
這些資訊和出版物並非旨在提供,也不構成TradingView提供或認可的任何形式的財務、投資、交易或其他類型的建議或推薦。請閱讀使用條款以了解更多資訊。
開源腳本
秉持TradingView一貫精神,這個腳本的創作者將其設為開源,以便交易者檢視並驗證其功能。向作者致敬!您可以免費使用此腳本,但請注意,重新發佈代碼需遵守我們的社群規範。
免責聲明
這些資訊和出版物並非旨在提供,也不構成TradingView提供或認可的任何形式的財務、投資、交易或其他類型的建議或推薦。請閱讀使用條款以了解更多資訊。