OPEN-SOURCE SCRIPT
已更新 Sadosi Gap Selecter
This indicator is designed to be used on daily charts. Please note that it will not work with weekly or hourly data.
The Sadosi Gap Selecter is a powerful indicator designed to identify price gaps that occur between specific dates on the chart. It allows users to easily analyze price movements between selected weeks and days, highlighting these periods with visual boxes. This helps traders spot potential trend reversals and key price levels more effectively. It’s particularly valuable for those utilizing gap trading strategies to identify market inefficiencies.
The core functionality of this indicator is based on detecting price differences between two selected days within a defined date range. With the Start Day (day1) and End Day (day2) options, you can choose the exact days of the week you’d like to analyze. For instance, if you want to focus on price movements from Friday to Monday, simply select those days. Additionally, the Start Week (week1) and End Week (week2) settings allow you to narrow down the time frame on a weekly basis, making it easy to analyze price behavior during specific periods of the year.
For visual customization, several options are available. The Color (renk) setting lets you choose between red and yellow for the highlighted boxes. The Transparency (op) control adjusts the background opacity from 0% (fully opaque) to 100% (completely transparent), allowing you to manage how prominently the boxes appear on your chart. Furthermore, the Border (hat) option enables you to add or remove borders around the boxes, helping reduce visual clutter or emphasize certain areas depending on your preference.
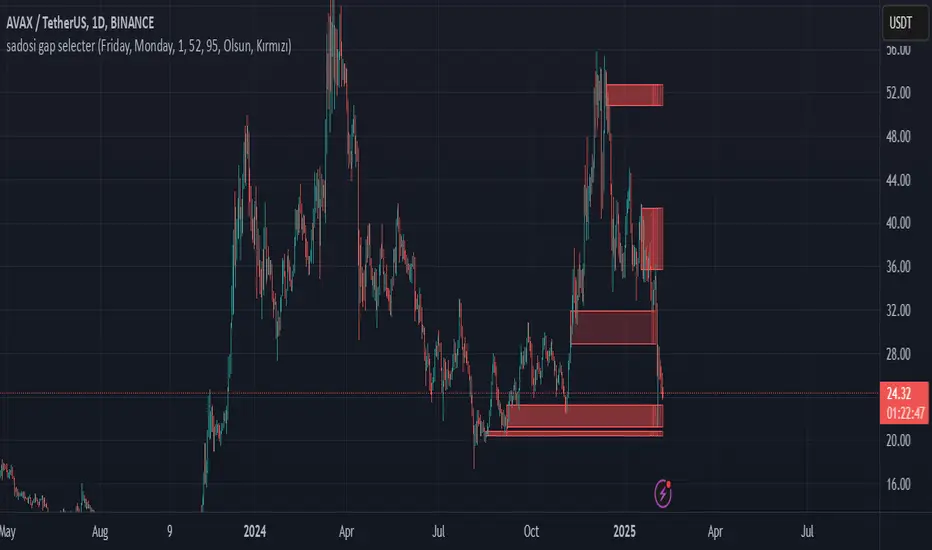
Once applied to the chart, the indicator automatically generates boxes for the specified date ranges. The upper and lower bounds of each box are determined based on the price movement within that period, providing insights into the direction and strength of the trend. However, this tool does not generate definitive buy or sell signals on its own. It is recommended to use it alongside other technical analysis tools to make more informed trading decisions.
With the Sadosi Gap Selecter, you can gain clearer insights into price behavior, strengthen your trend analyses using historical data, and fully customize the settings to match your trading style for more effective results.
This indicator is designed to be used on daily charts. Please note that it will not work with weekly or hourly data
The Sadosi Gap Selecter is a powerful indicator designed to identify price gaps that occur between specific dates on the chart. It allows users to easily analyze price movements between selected weeks and days, highlighting these periods with visual boxes. This helps traders spot potential trend reversals and key price levels more effectively. It’s particularly valuable for those utilizing gap trading strategies to identify market inefficiencies.
The core functionality of this indicator is based on detecting price differences between two selected days within a defined date range. With the Start Day (day1) and End Day (day2) options, you can choose the exact days of the week you’d like to analyze. For instance, if you want to focus on price movements from Friday to Monday, simply select those days. Additionally, the Start Week (week1) and End Week (week2) settings allow you to narrow down the time frame on a weekly basis, making it easy to analyze price behavior during specific periods of the year.
For visual customization, several options are available. The Color (renk) setting lets you choose between red and yellow for the highlighted boxes. The Transparency (op) control adjusts the background opacity from 0% (fully opaque) to 100% (completely transparent), allowing you to manage how prominently the boxes appear on your chart. Furthermore, the Border (hat) option enables you to add or remove borders around the boxes, helping reduce visual clutter or emphasize certain areas depending on your preference.
Once applied to the chart, the indicator automatically generates boxes for the specified date ranges. The upper and lower bounds of each box are determined based on the price movement within that period, providing insights into the direction and strength of the trend. However, this tool does not generate definitive buy or sell signals on its own. It is recommended to use it alongside other technical analysis tools to make more informed trading decisions.
With the Sadosi Gap Selecter, you can gain clearer insights into price behavior, strengthen your trend analyses using historical data, and fully customize the settings to match your trading style for more effective results.
This indicator is designed to be used on daily charts. Please note that it will not work with weekly or hourly data
發行說明
The Sadosi Gap Selecter is a powerful indicator designed to identify price gaps that occur between specific dates on the chart. It allows users to easily analyze price movements between selected weeks and days, highlighting these periods with visual boxes. This helps traders spot potential trend reversals and key price levels more effectively. It’s particularly valuable for those utilizing gap trading strategies to identify market inefficiencies.The core functionality of this indicator is based on detecting price differences between two selected days within a defined date range. With the Start Day (day1) and End Day (day2) options, you can choose the exact days of the week you’d like to analyze. For instance, if you want to focus on price movements from Friday to Monday, simply select those days. Additionally, the Start Week (week1) and End Week (week2) settings allow you to narrow down the time frame on a weekly basis, making it easy to analyze price behavior during specific periods of the year.
For visual customization, several options are available. The Color (renk) setting lets you choose between red and yellow for the highlighted boxes. The Transparency (op) control adjusts the background opacity from 0% (fully opaque) to 100% (completely transparent), allowing you to manage how prominently the boxes appear on your chart. Furthermore, the Border (hat) option enables you to add or remove borders around the boxes, helping reduce visual clutter or emphasize certain areas depending on your preference.
Once applied to the chart, the indicator automatically generates boxes for the specified date ranges. The upper and lower bounds of each box are determined based on the price movement within that period, providing insights into the direction and strength of the trend. However, this tool does not generate definitive buy or sell signals on its own. It is recommended to use it alongside other technical analysis tools to make more informed trading decisions.
With the Sadosi Gap Selecter, you can gain clearer insights into price behavior, strengthen your trend analyses using historical data, and fully customize the settings to match your trading style for more effective results.
Note: This indicator is designed to be used on daily charts. Please note that it will not work with weekly or hourly data.
開源腳本
秉持TradingView一貫精神,這個腳本的創作者將其設為開源,以便交易者檢視並驗證其功能。向作者致敬!您可以免費使用此腳本,但請注意,重新發佈代碼需遵守我們的社群規範。
免責聲明
這些資訊和出版物並非旨在提供,也不構成TradingView提供或認可的任何形式的財務、投資、交易或其他類型的建議或推薦。請閱讀使用條款以了解更多資訊。
免責聲明
這些資訊和出版物並非旨在提供,也不構成TradingView提供或認可的任何形式的財務、投資、交易或其他類型的建議或推薦。請閱讀使用條款以了解更多資訊。