OPEN-SOURCE SCRIPT
HDBhagat multi time frame box analysis
Title: Multi-Timeframe Box Analysis Indicator
Description:
The Multi-Timeframe Box Analysis Indicator is a powerful tool designed for use on the TradingView platform. It provides a visual representation of price movements across multiple timeframes, allowing traders to gain insights into potential trend changes and key support/resistance levels.
Key Features:
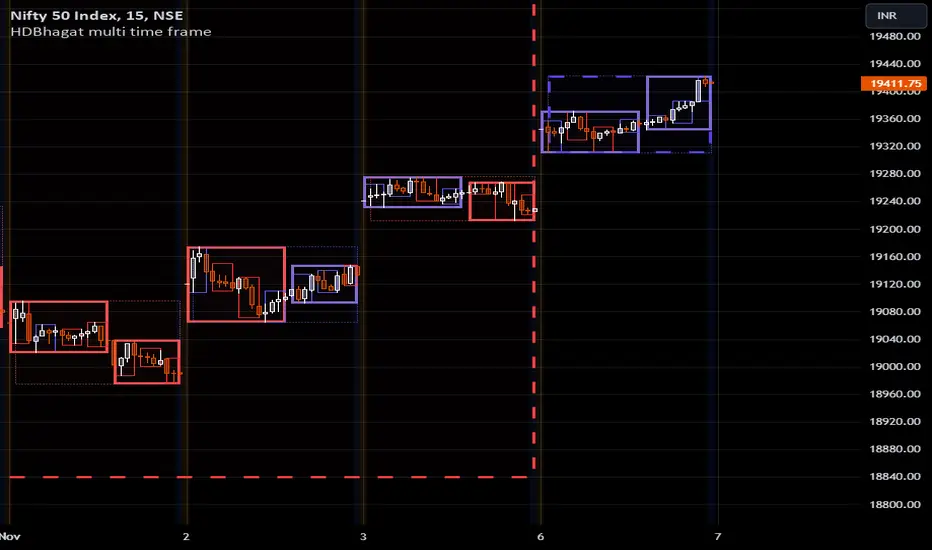
Multi-Timeframe Analysis: The indicator analyzes price data across different timeframes (1W, 1D, 4H, and 1H) simultaneously, providing a comprehensive view of market trends.
Box Visualization: The indicator represents price movements within each timeframe as colored boxes. Green boxes indicate bullish price action, while red boxes represent bearish movements.
Customizable Settings: Traders can easily adjust the input parameters to suit their specific trading preferences, including timeframe selection and box appearance settings.
Historical and Real-Time Updates: The indicator updates in real-time, ensuring that traders have access to the latest information. It also accounts for historical data to provide context for past price movements.
How to Use:
Apply the Multi-Timeframe Box Analysis Indicator to your TradingView chart.
Customize the indicator settings according to your preferred timeframes and visual preferences.
Observe the boxes on the chart to identify trends, potential reversals, and key support/resistance levels.
Use the information provided by the indicator to make informed trading decisions.
Disclaimer:
This indicator is a visual representation of historical and real-time price movements and is intended for informational purposes only. It does not guarantee future performance or trading success. Traders should conduct their own analysis and consider additional factors before making any trading decisions.
Note: Past performance is not indicative of future results. Always use proper risk management and consider consulting a financial advisor before making any trading decisions.
開源腳本
秉持TradingView一貫精神,這個腳本的創作者將其設為開源,以便交易者檢視並驗證其功能。向作者致敬!您可以免費使用此腳本,但請注意,重新發佈代碼需遵守我們的社群規範。
免責聲明
這些資訊和出版物並非旨在提供,也不構成TradingView提供或認可的任何形式的財務、投資、交易或其他類型的建議或推薦。請閱讀使用條款以了解更多資訊。
免責聲明
這些資訊和出版物並非旨在提供,也不構成TradingView提供或認可的任何形式的財務、投資、交易或其他類型的建議或推薦。請閱讀使用條款以了解更多資訊。