OPEN-SOURCE SCRIPT
Bitcoin Fibonacci Log Regression
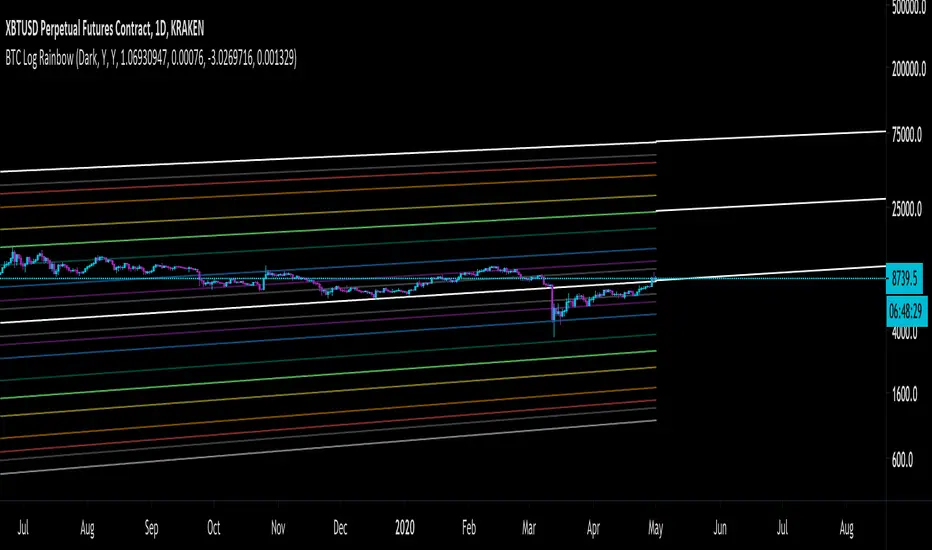
The "Zero Line" is the calculated logarithmic regression of Bitcoin over the last decade.
The rainbow above the Zero Line are the Fibonacci multiples from 0 --> 1 of the log regression (0.236, 0.382, etc.)
The rainbow below the Zero Line is identical, except that the multiples are negative (-0.236, -0.382, etc.)
For the first time ever, Bitcoin broke through the Zero Line (the natural regression) when it dumped on March 12-13. It looked at though the regression was invalidated when, in fact, it simply made an unprecedented move to a lower Fibonacci multiple.
Enjoy.
開源腳本
秉持TradingView一貫精神,這個腳本的創作者將其設為開源,以便交易者檢視並驗證其功能。向作者致敬!您可以免費使用此腳本,但請注意,重新發佈代碼需遵守我們的社群規範。
免責聲明
這些資訊和出版物並非旨在提供,也不構成TradingView提供或認可的任何形式的財務、投資、交易或其他類型的建議或推薦。請閱讀使用條款以了解更多資訊。
免責聲明
這些資訊和出版物並非旨在提供,也不構成TradingView提供或認可的任何形式的財務、投資、交易或其他類型的建議或推薦。請閱讀使用條款以了解更多資訊。