OPEN-SOURCE SCRIPT
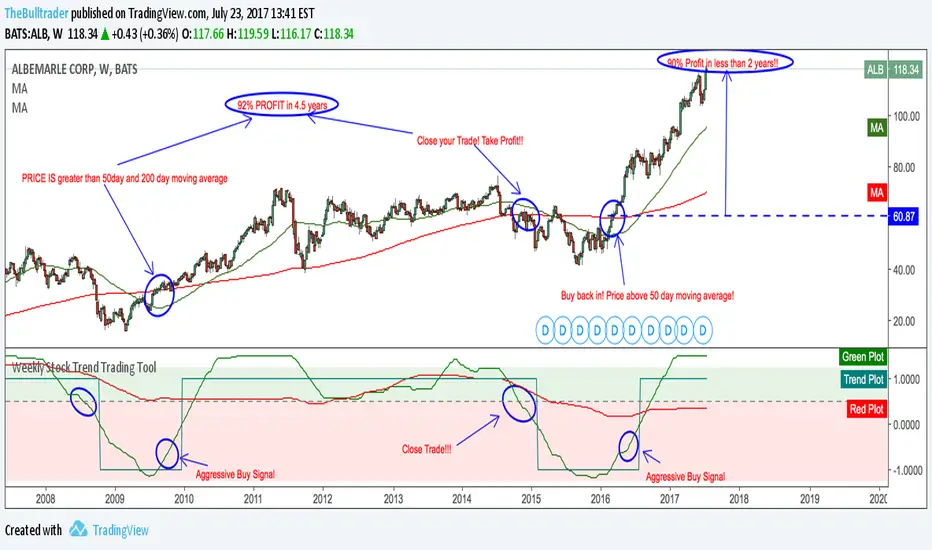
Weekly Stock Trend Trading Tool
// Created by TheBullTrader, 2017.
// Hi everyone, welcome to my Weekly Trend Trading Tool with the 50 day and 200 day moving averages
// This indicator scores each stock/ index individually and scores them on a simple scale -1.5 to +1.5
// This indicator has 2 zones: green zone = bullish, and red zone = bearish
// There are 3 plots: green = 50 day sma, red = 200 day sma, and trend signal= teal
// Buying Signal is when the green plot crosses teal plot or AGGRESSIVE Buy = green plot beginning to curve up from bearish zone.
// Sell Signal is when the green plot enters the RED ZONE
// By using this indicator as described, it will help you pick stock bottoms and COULD GET YOU OUT OF A STOCK CRASH!
// Recommendations is to scan this indicator against the top 100 US stocks with a long stock history greater than 10 years.
// I usually find 5-10 really good deals every few months. Slow and Easy way to build wealth. **Thanks for reading**
開源腳本
秉持TradingView一貫精神,這個腳本的創作者將其設為開源,以便交易者檢視並驗證其功能。向作者致敬!您可以免費使用此腳本,但請注意,重新發佈代碼需遵守我們的社群規範。
免責聲明
這些資訊和出版物並非旨在提供,也不構成TradingView提供或認可的任何形式的財務、投資、交易或其他類型的建議或推薦。請閱讀使用條款以了解更多資訊。
開源腳本
秉持TradingView一貫精神,這個腳本的創作者將其設為開源,以便交易者檢視並驗證其功能。向作者致敬!您可以免費使用此腳本,但請注意,重新發佈代碼需遵守我們的社群規範。
免責聲明
這些資訊和出版物並非旨在提供,也不構成TradingView提供或認可的任何形式的財務、投資、交易或其他類型的建議或推薦。請閱讀使用條款以了解更多資訊。