OPEN-SOURCE SCRIPT
Buyer vs Seller Control

Buyer vs Seller Control Analysis
Technical indicator measuring market participation through candlestick wick analysis
Overview:
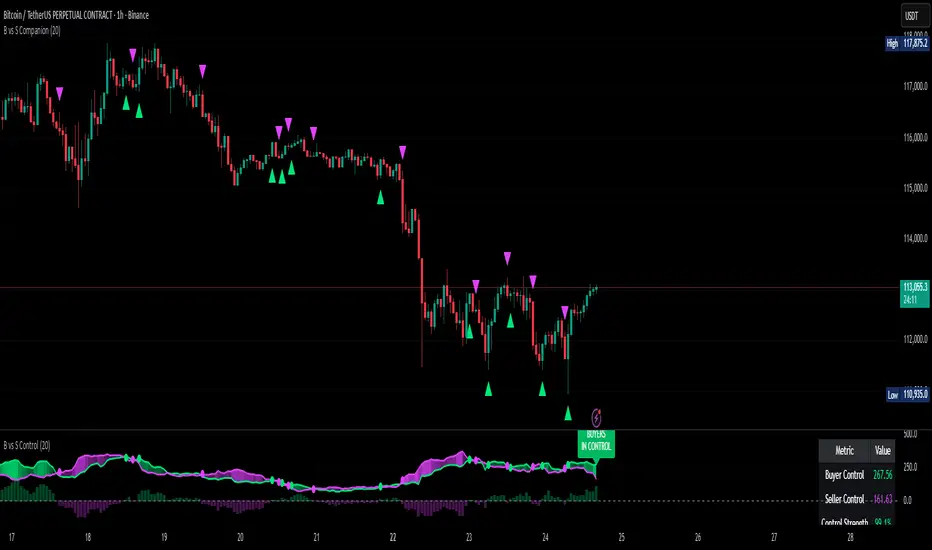
This indicator analyzes the relationship between closing prices and candlestick wicks to measure buying and selling pressure. It calculates two key metrics and displays their moving averages to help identify market sentiment shifts.
Calculation Method:
The indicator measures two distinct values for each candle:
Both values are then smoothed using a Simple Moving Average (default period: 20) to reduce noise and show clearer trends.
Visual Components:
Interpretation:
Fill Color Logic:
Settings:
Technical Notes:
This indicator provides a quantitative approach to analyzing candlestick patterns by focusing on where prices close relative to their intraday ranges.
Technical indicator measuring market participation through candlestick wick analysis
Overview:
This indicator analyzes the relationship between closing prices and candlestick wicks to measure buying and selling pressure. It calculates two key metrics and displays their moving averages to help identify market sentiment shifts.
Calculation Method:
The indicator measures two distinct values for each candle:
- Buyer Control Value: Distance from candle low to closing price
Pine Script® (close - low) - Seller Control Value: Distance from candle high to closing price
Pine Script® (high - close)
Both values are then smoothed using a Simple Moving Average (default period: 20) to reduce noise and show clearer trends.
Visual Components:
- Lime Line: 20-period SMA of buyer control values
- Fuchsia Line: 20-period SMA of seller control values
- Area Fill: Colored region between the two lines
- Histogram: Difference between buyer and seller control SMAs
- Zero Reference Line: Horizontal line at zero level
- Information Table: Current numerical values (optional display)
Interpretation:
When the lime line (buyer control) is above the fuchsia line (seller control), it indicates that recent candles have been closing closer to their highs than to their lows on average.
When the fuchsia line is above the lime line, recent candles have been closing closer to their lows than to their highs on average.
Fill Color Logic:
- Lime (green) fill appears when buyer control SMA > seller control SMA
- Fuchsia (red) fill appears when seller control SMA > buyer control SMA
- Fill transparency adjusts based on the magnitude of difference between the two SMAs
- Stronger differences result in more opaque fills
Settings:
- Moving Average Period: Adjustable from 1-200 periods (default: 20)
- Show Info Table: Toggle to display/hide the numerical values table
Technical Notes:
- The indicator works on any timeframe
- Values are displayed in the same units as the underlying asset's price
- The histogram shows the mathematical difference between the two SMA lines
- Transparency calculation uses a 50-period lookback for dynamic scaling
This indicator provides a quantitative approach to analyzing candlestick patterns by focusing on where prices close relative to their intraday ranges.
開源腳本
秉持TradingView一貫精神,這個腳本的創作者將其設為開源,以便交易者檢視並驗證其功能。向作者致敬!您可以免費使用此腳本,但請注意,重新發佈代碼需遵守我們的社群規範。
Get access to our indicators at: huntergatherers.tech
免責聲明
這些資訊和出版物並非旨在提供,也不構成TradingView提供或認可的任何形式的財務、投資、交易或其他類型的建議或推薦。請閱讀使用條款以了解更多資訊。
開源腳本
秉持TradingView一貫精神,這個腳本的創作者將其設為開源,以便交易者檢視並驗證其功能。向作者致敬!您可以免費使用此腳本,但請注意,重新發佈代碼需遵守我們的社群規範。
Get access to our indicators at: huntergatherers.tech
免責聲明
這些資訊和出版物並非旨在提供,也不構成TradingView提供或認可的任何形式的財務、投資、交易或其他類型的建議或推薦。請閱讀使用條款以了解更多資訊。