INVITE-ONLY SCRIPT
已更新 Market Price Order Divergence + Trapped Positions [Pt]
█ Introduction
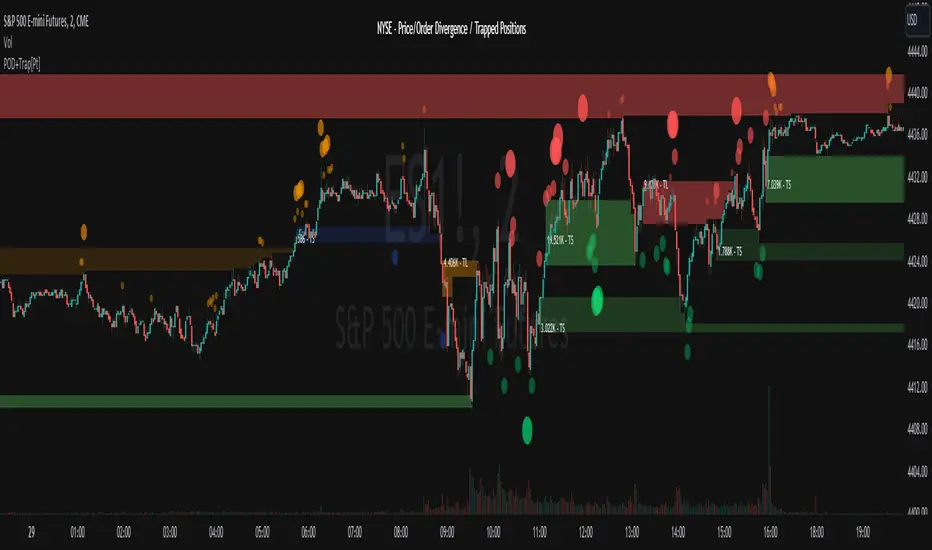
Specifically designed for trading on NYSE, NASDAQ, Dow Jones, and AMEX related instruments like SPY, QQQ, ES, NQ...etc., this innovative tool provides traders with advanced market insights to help them comprehend the market intricacies and make well-informed decisions. Comprising three primary features: Price Order Divergence (POD) Bubbles, Market Order Bubbles, and Trapped Positions/Zones, this tool assists traders in deciphering the nuances of market order flow and trends.
An important point to note is that TradingView doesn't currently provide direct access to market order data, such as buy and sell order flow. Therefore, this tool cleverly leverages TICK index data to estimate the overall market buy and sell strength.
█ Price Order Divergence (POD)
POD serves to detect disparities between the prices of US indices and estimated market orders during regular trading hours (9:30 to 16:00 EST). Bullish divergence indicates that the estimated market order flow is biased towards buy orders, despite bearish price action. In contrast, bearish divergence indicates that the market order flow is biased towards sell orders while the price exhibits bullish action. By default, PODs are visually represented as green bubbles under the candle for bullish divergence and red ones above the candle for bearish divergence. The bubble's size symbolizes the estimated market order strength.
█ Market Order Bubbles (MOB)
During extended or Globex hours, instead of POD, the tool uses Market Order Bubbles (MOB) to estimate market orders using volume data. Sophisticated algorithm is used to distinguish between bullish vs bearish volume. A strong bullish volume represents significant buy orders, whereas a strong bearish volume represents substantial sell orders. By default, MOBs during these hours are shown in blue for bullish and yellow for bearish divergence. Again, the bubble's size symbolizes the estimated market order strength.
█ Trapped Positions/Zones
Trapped positions materialize when PODs or MOBs emerge in trending markets. For example, a bearish divergence during an uptrend suggests significant selling (including shorting), and if the price continues ascending without offering short positions any profit, these positions become 'trapped shorts' and is shown as 'TS' in the zone. The opposite is true for 'trapped longs' or 'TL'.
A price range zone can be delineated from the trapped position candles. If prices revisit these zones, and the prevailing market trend stays bullish, the trapped shorts will probably liquidate near the break-even point to mitigate losses. The same rationale applies to bullish divergence in a downtrend. Therefore, these zone often times represents support / resistance zones.
█ Potential Use Cases
► Trend Confirmation: POD or MOB can confirm the strength of an ongoing trend. For example, during a bullish trend, a plethora of green bubbles or blue MOBs can affirm the trend's solidity.
► Spotting Reversals: Large, isolated POD or MOB bubbles could indicate potential market reversals. For instance, a prominent red bubble or yellow MOB during an uptrend might hint at an impending trend reversal.
► Risk Management: The Trapped Positions/Zones feature could assist in risk management. When prices approach these zones, traders can anticipate potential large market orders impacting price movements.
► Profit Optimization: This tool can aid traders in optimizing profits by identifying when trapped positions are likely to liquidate, thus predicting potential sharp price movements.
Remember, as with any tool, this should be used alongside other market analyses and not as a standalone indicator. Happy trading!
================================================================================================================
█ Settings Overview
◊ Market - available options: NYSE, NASDAQ, Dow Jones, AMEX. This will be displayed
◊ Lookback period- # of bars to lookback for detecting price vs market order divergences
https://www.tradingview.com/x/VeGf5Qou/
▼ Regular Hour - Price Order Divergence Bubbles
◊ Show Price Order Divergence (POD) Bubbles - toggle on/off for POD bubbles
◊ └ Use Market Order Sentiment only - Shows divergences between price movement and market order sentiment (amount of buying vs selling)
◊ └ Use Market Order Trend Bias - On top of market order sentiment, the indicator also looks at overall market short term trends to determine divergences
◊ └ Use Threshold [ ] Min. Threshold [ ] - For filtering order size, the lower the threshold, the more sensitive
◊ └ Use Volume Strength - Take volume into consideration as well, only shows divergence when there is strength in volume
▼ Extended Hour - Market Order Bubbles
◊ Show Market Order Bubbles - toggle on/off for MOB. Using volume data to estimate significant market order activities. Bubbles indicate possible large liquidation activities
◊ └ Volume Analysis period - lookback period for volume analysis
◊ └ Volume Strength period - lookback period for volume strength
https://www.tradingview.com/x/20itQikq/
▼ Trapped Position Zones
◊ Show Potential Traps - toggle on/off for un-activated trapped zones. They are shown as lightly shaded areas of potential traps. These areas will be activated once price hit the activation %
◊ Show Trapped positions (Regular Hours) - toggle on/off for POD trapped zones. By default, trapped shorts are shown in green, trapped tongs are shown in red.
◊ Show Trapped positions (Extended Hours) - toggle on/off for MOB bubbles. By default, trapped shorts are shown in blue, trapped tongs are shown in orange.
◊ └ Activation % - Trapped zones are activated if price goes x% of the potential trapped range in the undesirable direction. Default is 100%
◊ Liquidate display options - options: On first touch, Per touch, Fully liquidated
https://www.tradingview.com/x/Ssbm9QnU/
Trapped zones liquidate display options:
https://www.tradingview.com/x/tfOfvuhQ/
▼ Display
◊ General color settings for bubbles, trapped zones, and label size
◊ Use Emoji for bubbles - fun setting that displays bulls and bears by default. This helps really visualize where the bulls and bears are! 🤣🤣 These emoji can be changed in the style setting.
https://www.tradingview.com/x/i4m8uSZm/
▼ Trapped Zone Channel
The trapped zone channel represents a continuous channel of the closest activated trapped zone area. This allows for creating alerts for trapped zones, and the plot outputs allows for custom Pinescript integration.
◊ Trapped Zone Channel Buffer % - Adds upper and lower buffer for trapped zone channel
◊ Show Trapped Channel - toggle on/off on trapped zone channels
◊ └ Remove channel changing lines - toggle on/off the transition plot lines when switching to the closest trapped zones
◊ Show Trapped Channel Fill - toogl
https://www.tradingview.com/x/AuX5zJxb/
▼ Extra
◊ Display settings for chosen market and indicator title
▼ Trend Follower
◊ Show Trend Following Bar Color - toggle trend follower algorithm. This is an experimental trend following algorithm that attempts to detect bullish, neutral and bearish trends.
https://www.tradingview.com/x/ekb4UHav/
▼ Outputs
◊ Output Bubbles
Outputs for Bubbles for external interface. These can be used as inputs to your own indicator or strategy Pinescript. For more info, take a look at this TradingView blog:
tradingview.com/blog/en/more-external-inputs-for-scripts-38014/
Bubble type can be chosen within the settings:
Both - Default, output will include both Market Price Order Divergence Bubbles (during Regular Hours) and Market Order Bubbles (during Extended Hours)
POD Only (RTH) - Output will include only Market Price Order Divergence Bubbles; otherwise, output = 0 during Extended Hours
MOB Only (ETH) - Output will include only Market Order Bubbles; otherwise, output = 0 during Regular Hours
Market Order Bubbles output values:
3 = Large size Bullish Bubble
2 = Medium size Bullish Bubble
1 = Small size Bullish Bubble
0 = No Bubble
-1 = Small size Bearish Bubble
-2 = Medium size Bearish Bubble
-3 = Large size Bearish Bubble
https://www.tradingview.com/x/W5266Z0r/
發行說明
█ Feature updates▼ Alerts
◊ Added alerts for New Trapped Zone detection
◊ Added alerts for POD bubbles and MOB bubbles
發行說明
◊ Added alerts for All Bullish or Bearish Bubbles發行說明
◊ Added bar colors option for showing divergences. ● Note that 2 alert conditions for 'weak' divergence bubbles had to be removed to accommedate for this new feature, due to Pinescript output limitations.
● Also note that only one of the two bar color options can be displayed at the same time. This new feature takes precedences over trend bar coloring.
發行說明
● Runtime bug fix: Fixed error on referencing too many historical candles發行說明
◊ Added option to use custom ticker / index for calculating POD. By default, the indices used for POD calculations are as follows:NYSE => USI:TICK
NASDAQ => USI:TICKQ
Dow Jones => USI:TICKI
AMEX => USI:TICKA
發行說明
◊ Fixed bug- 'Show Trapped Position' toggles weren't working properly
發行說明
◊ Minor bug fix- Removed duplicate zone labels
Purchases / Subscriptions / Support - buymeacoffee.com/ptgambler
PayPal - paypal.me/PtGambler
You can reach me privately through my Discord Channel: discord.gg/WMQfaVGyQC
PayPal - paypal.me/PtGambler
You can reach me privately through my Discord Channel: discord.gg/WMQfaVGyQC
免責聲明
這些資訊和出版物並不意味著也不構成TradingView提供或認可的金融、投資、交易或其他類型的意見或建議。請在使用條款閱讀更多資訊。