PROTECTED SOURCE SCRIPT
已更新 Daily Engulfing Pattern Detector
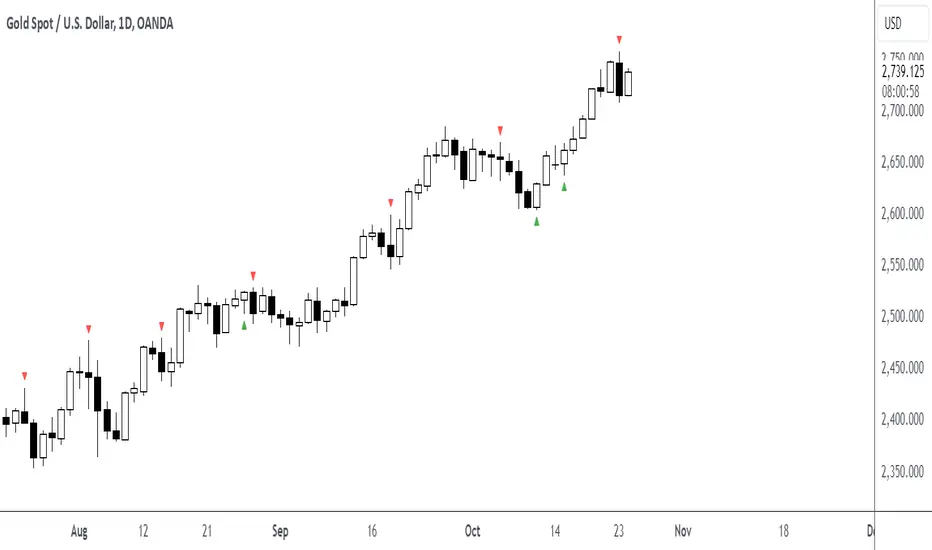
This indicator identifies bullish and bearish engulfing patterns on daily timeframes.
A bullish engulfing pattern occurs when a green candle completely engulfs the previous red candle,
taking out its low and closing above both its open and close prices. This suggests a potential trend reversal from bearish to bullish.
A bearish engulfing pattern occurs when a red candle completely engulfs the previous green candle,
taking out its high and closing below both its open and close prices. This suggests a potential trend reversal from bullish to bearish.
Features:
- Works on daily timeframe by default (customizable)
- Displays visual markers: green triangles for bullish patterns, red triangles for bearish patterns
- Includes built-in alerts for both pattern types
Set up alerts by right-clicking the indicator and selecting "Create Alert"
發行說明
This indicator identifies bullish and bearish engulfing patterns on daily timeframes.A bullish engulfing pattern occurs when a green candle completely engulfs the previous red candle,
taking out its low and closing above both its open and close prices. This suggests a potential trend reversal from bearish to bullish.
A bearish engulfing pattern occurs when a red candle completely engulfs the previous green candle,
taking out its high and closing below both its open and close prices. This suggests a potential trend reversal from bullish to bearish.
Features:
- Works on daily timeframe by default (customizable)
- Displays visual markers: green triangles for bullish patterns, red triangles for bearish patterns
- Includes built-in alerts for both pattern types
Set up alerts by right-clicking the indicator and selecting "Create Alert"
受保護腳本
此腳本以閉源形式發佈。 不過,您可以自由使用,沒有任何限制 — 點擊此處了解更多。
免責聲明
這些資訊和出版物並非旨在提供,也不構成TradingView提供或認可的任何形式的財務、投資、交易或其他類型的建議或推薦。請閱讀使用條款以了解更多資訊。
受保護腳本
此腳本以閉源形式發佈。 不過,您可以自由使用,沒有任何限制 — 點擊此處了解更多。
免責聲明
這些資訊和出版物並非旨在提供,也不構成TradingView提供或認可的任何形式的財務、投資、交易或其他類型的建議或推薦。請閱讀使用條款以了解更多資訊。