OPEN-SOURCE SCRIPT
已更新 kou_di
The Simple Moving Average (SMA) is the most basic and widely used type of moving average. It’s calculated by taking the arithmetic mean of a given set of prices or data points over a specified period.
SMA = (P1 + P2 + ... + Pn) /n
Where
P1, P2, ... , Pn = prices of data points
n = number of periods
When a new SMA is calculated for a new candle stick, the oldest data point P1 is removed from the original data points (P1 + P2 + ... + Pn) and a new price Pn+1 is added to form a new SMA:
SMA_new = (P2 + ... + Pn + Pn+1) /n
If Pn+1 < P1, SMA line will become downward trend, or if Pn+1 > P1, SMA line will become upward trend. This logic help us predict the moving direction of SMA line which will form the prices trend in the future.
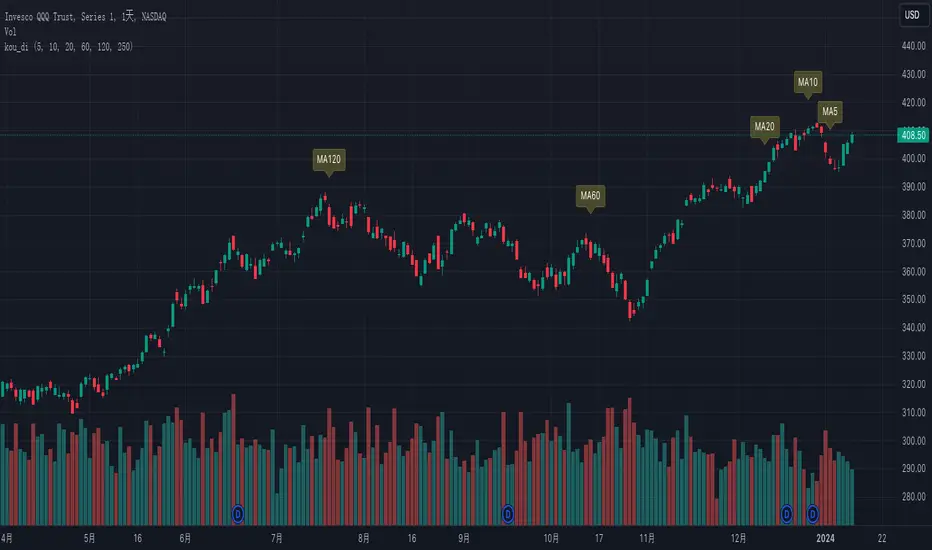
So it's important to highlight the "P1" candle stick for SMAs of different periods to help us predict the trend of SMA lines.
Since SMA5, SMA10, SMA20, SMA60, SMA120, SMA250 are the most popular SMAs, this indicator marks the "P1" candle stick for all of them by default, but you can optionally disable them.
该指标用于显示SMA5, SMA10, SMA20, SMA60, SMA120, SMA250 的扣抵位来监测均线拐点的出现
SMA = (P1 + P2 + ... + Pn) /n
Where
P1, P2, ... , Pn = prices of data points
n = number of periods
When a new SMA is calculated for a new candle stick, the oldest data point P1 is removed from the original data points (P1 + P2 + ... + Pn) and a new price Pn+1 is added to form a new SMA:
SMA_new = (P2 + ... + Pn + Pn+1) /n
If Pn+1 < P1, SMA line will become downward trend, or if Pn+1 > P1, SMA line will become upward trend. This logic help us predict the moving direction of SMA line which will form the prices trend in the future.
So it's important to highlight the "P1" candle stick for SMAs of different periods to help us predict the trend of SMA lines.
Since SMA5, SMA10, SMA20, SMA60, SMA120, SMA250 are the most popular SMAs, this indicator marks the "P1" candle stick for all of them by default, but you can optionally disable them.
该指标用于显示SMA5, SMA10, SMA20, SMA60, SMA120, SMA250 的扣抵位来监测均线拐点的出现
發行說明
Fix a bug發行說明
Update the display of labels發行說明
Addressed comment - Allow changing the color of label and label text開源腳本
秉持TradingView一貫精神,這個腳本的創作者將其設為開源,以便交易者檢視並驗證其功能。向作者致敬!您可以免費使用此腳本,但請注意,重新發佈代碼需遵守我們的社群規範。
免責聲明
這些資訊和出版物並非旨在提供,也不構成TradingView提供或認可的任何形式的財務、投資、交易或其他類型的建議或推薦。請閱讀使用條款以了解更多資訊。
免責聲明
這些資訊和出版物並非旨在提供,也不構成TradingView提供或認可的任何形式的財務、投資、交易或其他類型的建議或推薦。請閱讀使用條款以了解更多資訊。