INVITE-ONLY SCRIPT
已更新 Sonarlab - Trendline Liquidity Indicator
**This is not a normal Trend Line Indicator**
Most of the concepts we get thought online are to good to be true. Buy and sell off the touch of the trend line and you will be winning! You probably find out already that this ain't the way to trade. Trend lines mostly gets broken and you will be taken out.
he reason behind this is that the trend lines sparks the interests of Institutions. They use those area's to stop people out and use them as fuel for their positions: Liquidity.
TLL: Trend Line Liquidity
Lets show you an example on how to use these TLL markings 👇

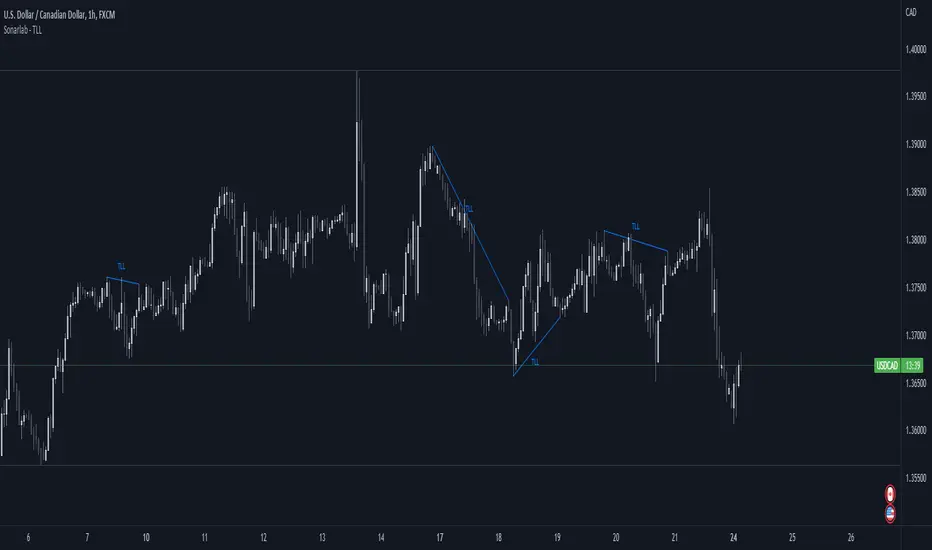
In this example above we can see a beautiful example of the TLL indicator mapping out the TLL. The Imbalance Indicator shows us with the BPR (balanced price range) there is a sign of going short. The other confluence we can add is the TLL, which price likes to clear in these situations.

In this other example we also see two TLL resting on top. We see that price tried to break the SL (swing low), but the fake out detection showed us this was a grab on liquidity. After that we can see that on the LTF we get a displacement and we can assume that price is going to target the TLL.

Another example where price cleared the TLL and used is a targets.
This indicator will map the Trend Line Liquidity for you, so you are more aware of the liquidity that is resting around you. The Indicator has the following inputs:
Sensitivity A lower sensitivity create smaller trend lines, where a higher sensitivity creates bigger trend lines.
Display limit: The amount of lines you want the indicator to display
Line type/ text size (styling options)
Most of the concepts we get thought online are to good to be true. Buy and sell off the touch of the trend line and you will be winning! You probably find out already that this ain't the way to trade. Trend lines mostly gets broken and you will be taken out.
he reason behind this is that the trend lines sparks the interests of Institutions. They use those area's to stop people out and use them as fuel for their positions: Liquidity.
TLL: Trend Line Liquidity
Lets show you an example on how to use these TLL markings 👇
In this example above we can see a beautiful example of the TLL indicator mapping out the TLL. The Imbalance Indicator shows us with the BPR (balanced price range) there is a sign of going short. The other confluence we can add is the TLL, which price likes to clear in these situations.
In this other example we also see two TLL resting on top. We see that price tried to break the SL (swing low), but the fake out detection showed us this was a grab on liquidity. After that we can see that on the LTF we get a displacement and we can assume that price is going to target the TLL.
Another example where price cleared the TLL and used is a targets.
This indicator will map the Trend Line Liquidity for you, so you are more aware of the liquidity that is resting around you. The Indicator has the following inputs:
Sensitivity A lower sensitivity create smaller trend lines, where a higher sensitivity creates bigger trend lines.
Display limit: The amount of lines you want the indicator to display
Line type/ text size (styling options)
發行說明
- Added option to change the "TLL" text- Fixed the text size bug
發行說明
- Minor Changes發行說明
- Added Higher Timeframe TLL option- Added mitigation options
僅限邀請腳本
只有經作者批准的使用者才能訪問此腳本。您需要申請並獲得使用權限。該權限通常在付款後授予。如欲了解更多詳情,請依照以下作者的說明操作,或直接聯絡vuetratrading。
除非您完全信任其作者並了解腳本的工作原理,否則TradingView不建議您付費或使用腳本。您也可以在我們的社群腳本中找到免費的開源替代方案。
作者的說明
Send us a PM or check out the links on our TV profile
提醒:在請求訪問權限之前,請閱讀僅限邀請腳本指南。
免責聲明
這些資訊和出版物並不意味著也不構成TradingView提供或認可的金融、投資、交易或其他類型的意見或建議。請在使用條款閱讀更多資訊。