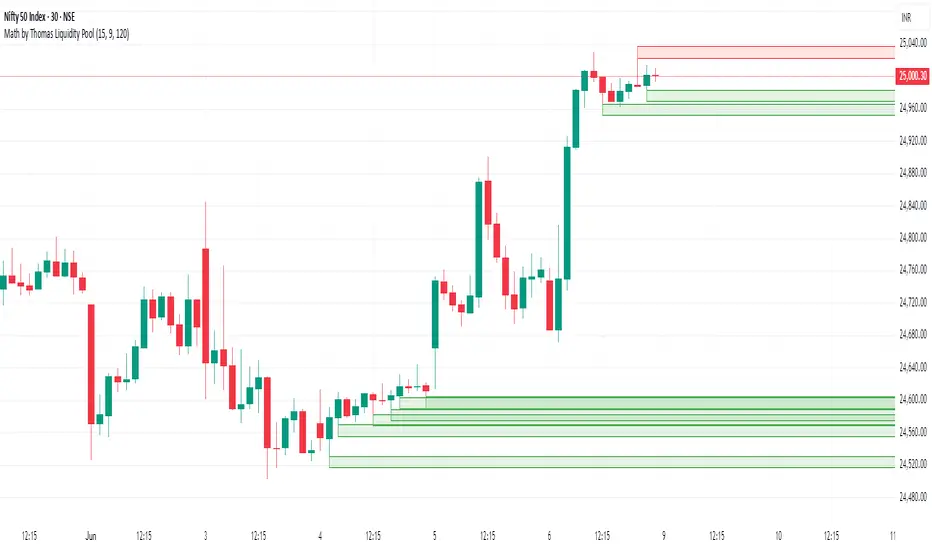
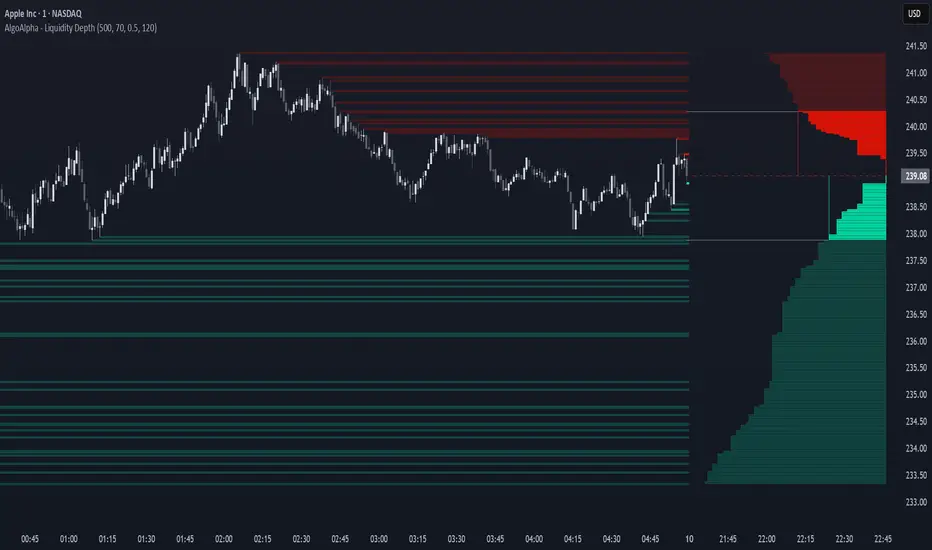
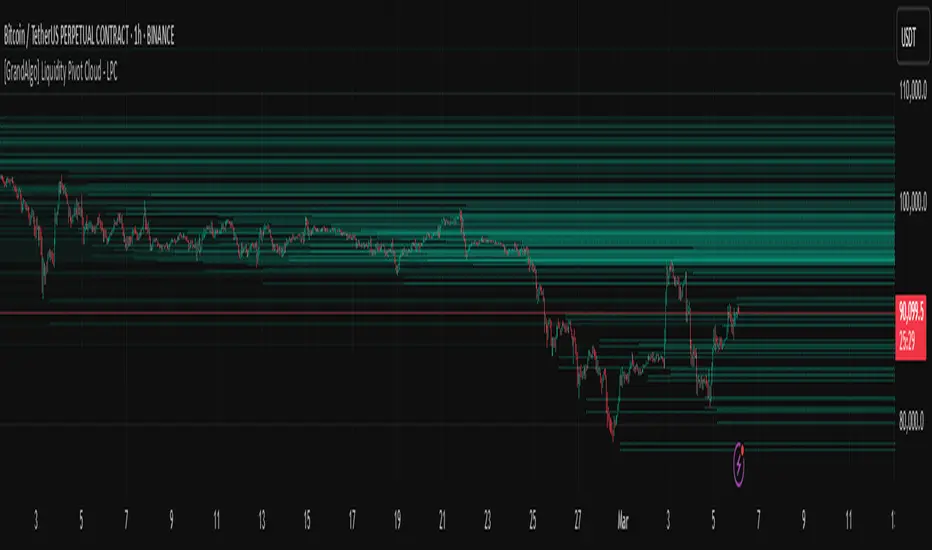
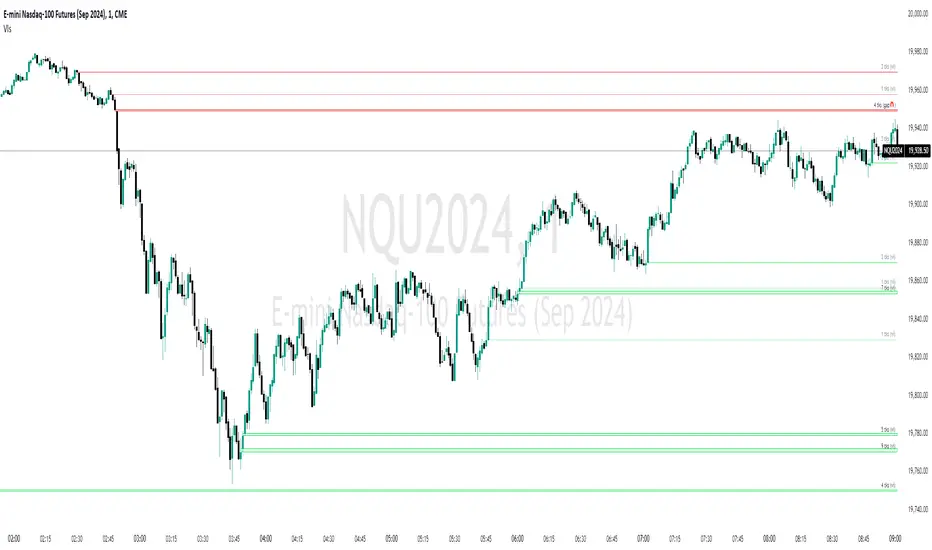
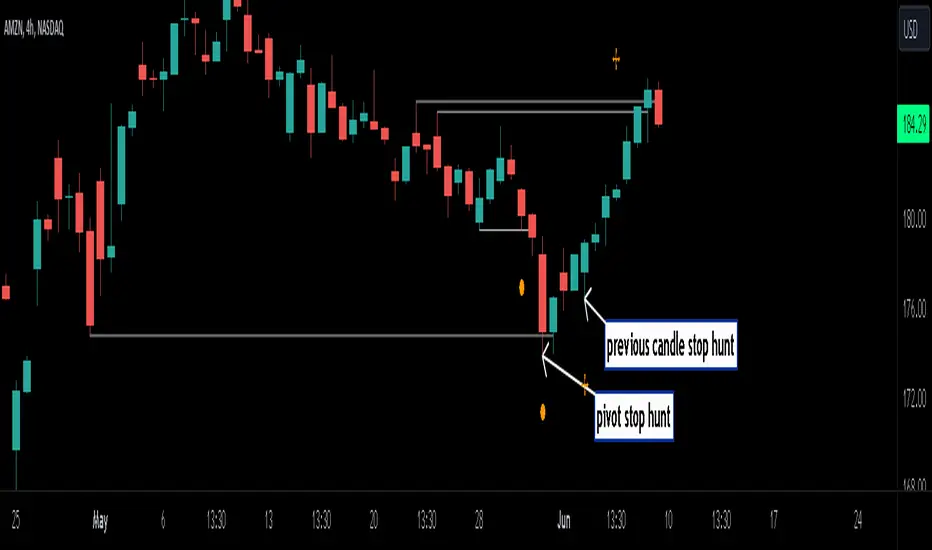
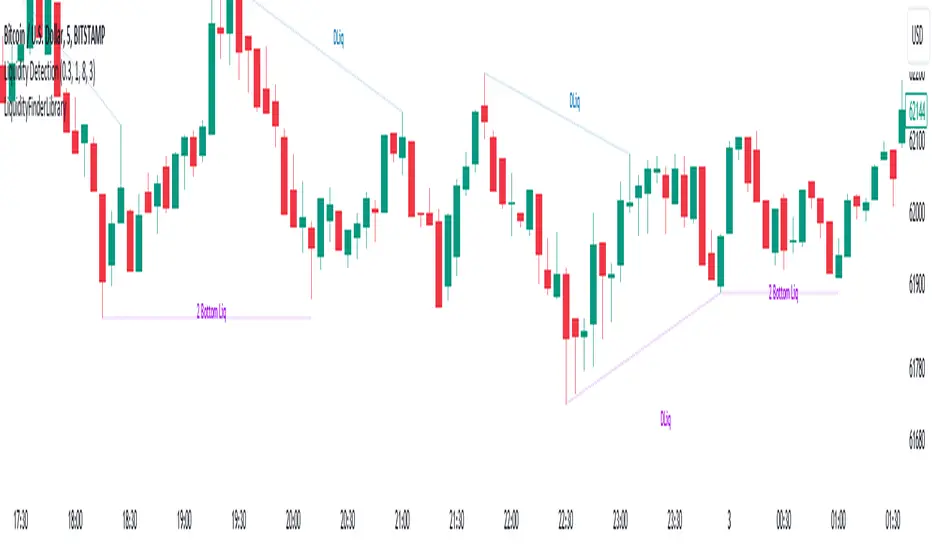
Equal Highs and Lows [D4A]Overview
This indicator identifies and displays **Relative Equal High (EQH)** and **Equal Low (EQL)** zones, highlighting price levels where the market has stalled or reversed from before. These areas are considered liquidity zones because they mark locations where price has previously paused, reversed, or encountered significant buying or selling activity, and as a result there is a concentration of buy-stops or sell-stops in these zones. In trading approaches such as Smart Money Concepts (SMC/ICT), equal highs and lows are considered important liquidity targets that may influence future market movement, as larger participants are thought to seek the liquidity concentrated around these levels.
How this script is different from other similar tools
- It marks two pivots as Equal Highs only if the second pivot is lower (within the threshold) than the 1st one and likewise, two pivots are marked as Equal Lows only if the second pivot is situated higher (within the threshold) than the 1st pivot. In other words the price has still a reason to re-visit this area
- It provides three different, user configurable pivot lengths that the script scans at the same type in search of EQHL. Most scripts use only one pivot length thus missing on many potential targets
- Apart from main labels, it draws also side labels at defined location which can be convenient to see all EQHL target levels at glance
How It Works
The indicator analyses **pivot highs** and **pivot lows** to locate meaningful swing points on the chart. When two consecutive pivots form within a user-defined price threshold, they are recognized as an Equal Highs or Equal Lows. A line is then drawn between the matching pivots, and the zone is labelled for easy identification.
Since market prices rarely align at exactly the same value, the indicator includes a **ATR Threshold** setting. This parameter specifies the maximum percentage difference allowed between two pivot levels for them to qualify as equal, giving traders the flexibility to adjust the detection based on market volatility and their preferred level of precision.
How to Use
(EQH/EQL) are strong liquidity targets: Use the marked levels as potential targets for take-profits, as price often seeks out these "equal" levels to sweep liquidity.
SETTINGS
- Show EQHL - show labels and drawings
- # of bars to use - limits the number of bars used to find EQHL
- Threshold / ATR Length - are used to establish difference between two levels being considered "equal high" or "equal low"
- Show Labels - define labels shown
- Show Side Labels - enables additional labels on the side of the chart
- Right Coordinate - how many bars to the right the side labels are displayed at
- Pivot Length - there are three different lengths to configure to cover large distance difference between two pivots
- Remove All Drawings After Sweep - when EQH or EQL levels are swept, the corresponding drawings are removed from memory
-----------------
Disclaimer
The content provided in this script is for educational and informational purposes only. It does not constitute financial advice, investment recommendations, or a solicitation to buy or sell any financial instruments. I will not accept liability for any loss or damage, including without limitation any loss of profit, which may arise directly or indirectly from the use of or reliance on such information.
All investments involve risk, and the past performance of a security, industry, sector, market, financial product, trading strategy, backtest, or individual's trading does not guarantee future results or returns. Investors are fully responsible for any investment decisions they make. Such decisions should be based solely on an evaluation of their financial circumstances, investment objectives, risk tolerance, and liquidity needs. 指標

Liquidity Sweep Hunter [BigBeluga]🔵 OVERVIEW
The Liquidity Sweep Hunter is a smart, volume-aware charting tool that automatically detects major support and resistance levels.
Unlike basic horizontal line indicators that just draw lines on every swing high or low, this script filters levels based on volume strength . It identifies the "heavy" levels where big money has clearly participated, projects them forward as active boundaries, and alerts you the exact moment price "sweeps" through them.
🔵 FEATURES
The system works by tracking the relationship between price pivots and real-time volume:
1 — Volume-Weighted Level Detection
Smart Pivot Filtering: The engine identifies price pivots ( Length ) but only confirms a level if the volume at that pivot exceeds your defined Filter threshold. This ignores "weak" pivots and keeps your focus only on high-conviction zones.
Dynamic Intensity Engine: The indicator automatically changes the look of the lines based on volume. Levels created with higher volume activity get thicker lines ( Max Line Width ) and higher opacity, making them visually stand out more on your chart.
2 — Automated Liquidity Sweep & Break Logic
Sweep Alerts (✔): When the price briefly dips below a support level (or spikes above a resistance level) and then closes back inside, the indicator plots a checkmark (✔) to identify the "liquidity sweep."
Smart Self-Cleaning: If the price candles break directly through a support or resistance line, the indicator detects the structural breach, changes the line to a dotted style, and removes it from your active list. This keeps your chart free of outdated, broken levels.
🔵 HOW TO USE
This tool is designed to help you trade based on where market participants have placed their stops and orders:
Identify High-Volume Anchors: Use the thick, bold lines to spot the most important support and resistance levels on your timeframe. These are the zones where the script detected significant institutional interest.
Look for Sweep Confirmations: Watch for the (✔) checkmarks after a line is tagged. A liquidity sweep often signals that the market is grabbing "stop-loss" liquidity before reversing in the opposite direction.
Manage Trade Exit Points: Use the lines as your target zones. Since the script automatically turns lines into "dotted" style when they are broken, you have a visual trigger to cut a position if a key structural level fails.
🔵 NOTES
Why this implementation is unique:
It combines two powerful concepts—volume analysis and pivot structure—into a single, lightweight tool that doesn't overwhelm your chart.
The "Dynamic Intensity" settings allow you to see at a glance which levels are mathematically the most significant based on the volume data behind them.
It is a "self-managing" system; by automatically deleting broken levels, it ensures your screen stays clear for your actual trade execution.
指標

Strong Liquidity Outlook | ProjectSyndicateStrong Liquidity Outlook tracks the two opposed states of liquidity — the voids price must fill and the order shelves price must sweep — scores them on a single 0–10 scale, merges them where they agree, and projects a forward route through them. Every number on the panel is measured, not invented.
🟥🟩 IMPORTANT INFO: Because zone height, reach and distance are all ATR-derived, the engine self-calibrates to each symbol. Start on M5–H1. On daily charts raise Min Gap Size (%), as intraday voids become noise.
🧲 Two Draw Engines, One Scoreboard — the core of this tool. Most level tools track one thing. This one tracks the two opposed states of liquidity and forces them to compete on the same 0–10 scale. Imbalance zones are the voids — bar-to-bar gaps where no trade occurred, an absence price is drawn back to fill. Stop-pool zones are the opposite — dense shelves of resting orders sitting above swing highs and below swing lows, ATR-sized and volume-weighted. A gap is a vacuum; a pool is a wall. Both pull price, for opposite reasons, and until now you had to run two indicators to see them together.
🎯 Confluence Merging — where the real levels come from. Overlapping same-side zones do not stack into visual mush. They fuse. When a gap opens into the same pocket a stop pool already occupies, the two merge into one confluence zone, their volume mass adds, their scores compound, and the zone is tagged ×2 or ×3 on the chart. The levels that survive this merge are the ones two independent mechanisms agree on — and they rise to the top of the ranked panel automatically. No manual confluence hunting.
⭐ 0–10 Zone Strength Score. Every zone is graded on a transparent weighted blend of five factors: volume pressure at formation, zone size relative to ATR, number of tests it has survived, confluence depth, and proximity to current price. Optional idle decay bleeds a zone's score toward a floor while price ignores it, so a stale level cannot masquerade as a live one. Strong zones render sharp and opaque; weak ones fade. Every weight is exposed in settings.
♻️ Live Zone Lifecycle — INTACT → CONSUMED % → FILLED / SWEPT. A zone above price is eaten from its floor upward. A zone below price is eaten from its ceiling down. The script renders that literally: the bright remainder is the unworked part of the void, the dimmed slice behind it is what price has already consumed, and the label reports the exact percentage. When price closes fully through, an imbalance is marked FILLED and a pool is marked SWEPT. Every fresh re-entry — not just the first — counts as a new test and feeds the score.
🗺️ Scenario Builder — the powerful new part. This is not a hand-drawn arrow. The script walks your live zone map forward from the last bar and assembles a route from surveyed levels:
1 · TRIGGER — the nearest qualifying zone in the trigger direction. Price runs the stops first.
2 · REVERSE — a retrace of that leg. If a real zone sits within your ATR tolerance of that level, the waypoint snaps onto it and is flagged ⚑.
3 · RETEST — a partial recovery that deliberately fails short of the trigger extreme.
4 · TARGET — the strongest-scoring zone on the far side of price. Not the flashiest, not the furthest. The highest-graded one.
5 · EXTENSION — the next zone beyond target, if one exists.
Trigger direction defaults to Auto, taken from the live net-pull bias. Bars-per-leg are allocated proportionally to price travel, so steep legs stay steep and the path never looks synthetic.
🧮 Honest Path Confidence (0–100), never a fake "chance". Here is the rule the entire script is built on: if a leg is not anchored to a real, scored zone, it is drawn hollow and labelled as projected. If no zone exists on the far side, the target falls back to a measured move — and it says so, the vertex is drawn unfilled, and the confidence meter is cut. An unsnapped reverse waypoint is dimmed. Path Confidence is the mean of the trigger and target zone scores, penalized for anything unanchored. It is labelled confidence in the levels, not probability of the path. You will never see an invented "87% chance price reaches this target." The path is level geometry rendered forward. It re-solves every tick as zones score up, decay, or get swept — a current-state projection, not a committed forecast.
📊 Five-Slide Dashboard — every figure measured. A compact panel that auto-rotates (or pins to one slide) with ●○○○○ position pips.
OVERVIEW — regime, live zone counts by side, elite count, a tug-of-war net-pull meter, and the nearest zone above and below with strength bars and real distance.
TOP ZONES — the eight highest-scored live zones, ranked, each with type icon, confluence multiplier, price, and a score meter.
STATISTICS — this is the part nobody else ships. Gap fill rate, pool sweep rate, average bars to resolution, and post-resolution reaction rate, each with its own meter and its raw hits / total count exposed beside it.
PRESSURE — zone mass by side, estimated volume split, net delta above and below, and how many zones are partially eaten.
SCENARIO — the full waypoint list with prices, move-to-target in % and ATR, an approximate R multiple, the confidence meter, and an explicit anchoring readout.
📐 Statistics That Cannot Lie To You. Every zone ever detected stays in the denominator. Retiring a stale zone from the chart never removes it from the fill-rate sample. The reaction test — did price travel back n × ATR within n bars after a fill or sweep? — scores each resolution exactly once, hit or miss, and both numbers are shown. Samples under 20 events are flagged THIN — read with care rather than dressed up as a rate. Volume and delta figures are derived from bar geometry, not tick data, and the panel states that on its own row.
🔬 Non-Repainting By Construction. Gaps are read off closed bars only. Pivot-confirmed pools lag by your Pivot Right setting — that is confirmation lag, not repainting, and nothing is ever redrawn backwards once a zone is placed. All state mutations happen on bar close.
🎨 Clean Themed Visuals. Dashed borders on imbalance zones, solid on stop pools, so you read the type at a glance. Midlines on elite zones. Nearest-zone rails extending to current price. The scenario path renders as a three-pass polyline — two soft glow layers under a crisp core — with diamond waypoint markers, a terminal arrowhead, and dotted trigger/target rails.
🔔 Built-In Alerts. New imbalance zone, new stop-pool zone, zone tested, imbalance filled, stop pool swept, elite zone approach, and scenario trigger reached — each firing on bar close, formatted for manual or automated use.
🔧 Fully Customizable. Both detectors toggle independently. Gap size floors in both % and ATR. Pivot sensitivity, pool height and offset. All five score weights, decay rate and floor. Merge threshold, stale-zone retirement, reaction window and size. The complete scenario filter set — path detail, trigger direction, waypoint score floor, projection length, retrace and retest ratios, snap tolerance. Plus every colour, label, meter and panel option.
🎯 Why this is different. Most liquidity tools show you one kind of level and attach a fabricated probability to it. This one tracks both kinds — the voids and the walls — scores them on one honest scale, merges them where they agree, then projects a route through them and tells you which parts of that route are real. Then it grades its own zones against history and shows you the fill rate, the sweep rate, and the reaction rate, with the raw counts, including when the sample is too thin to trust.
🧭 How to trade it. Read the panel before the chart. The net-pull meter tells you which side the field is leaning. The TOP ZONES slide tells you which levels have actually earned attention. Treat the scenario trigger as where liquidity gets taken and the target as the logical objective — and check the anchoring row first. A solid, snapped path into a high-scored target is a clean roadmap. A hollow TARGET (projected) vertex means the market has no graded level behind that move, and you should size accordingly. Cross-check the STATISTICS slide for your symbol: if gaps on your instrument fill 38% of the time, trade them like a 38% event.
⚠️ Important. This is a decision-support tool, not a standalone buy/sell system, and it makes no performance guarantees. Everything it displays is descriptive of current zone strength, real distance, and measured historical behaviour. Path Confidence is a read on the quality of the levels involved, not a forecast of price. Volume-pressure figures are geometric estimates, not tick data. Historical rates describe what has happened on the loaded chart and do not predict what will happen next; thin samples are flagged for exactly that reason. Behaviour varies by symbol, timeframe, and configuration. Always combine it with your own analysis and risk management, and test it on your market before trading it live. 指標

Liquidity Walls [TradingIQ]Hello Traders!
🔹 Liquidity Walls
Liquidity Walls is an order-flow efficiency and absorption tool designed to highlight areas where aggressive buying or selling pressure fails to move price as expected.
Instead of only showing where price moved, this indicator asks a deeper question:
Did the market respond properly to the pressure behind the move?
When strong delta enters the market but price does not travel efficiently, that can suggest absorption, trapped aggression, or opposing liquidity .
Liquidity Walls is built to identify those moments and project potential liquidity clusters directly onto the chart.
lower timeframe delta analysis
delta-implied price movement
inefficient candle detection
absorption-based liquidity zones
adaptive expected close modeling
active liquidity wall tracking
automatic zone invalidation
🔹 What the indicator shows
🔸 Delta-Based Expected Close
The indicator estimates where price should have closed based on the relationship between delta and price movement.
It compares:
actual price movement
delta-driven expected movement
how much price should have moved based on recent behavior
This creates a delta-implied close , shown directly on the chart.
The core idea is simple:
If aggressive buyers or sellers entered the market, price should usually respond.
When it does not, that mismatch can reveal hidden liquidity.
🔸 Inefficient Candle Detection
Candles are colored when the script detects inefficient movement between delta and price.
This means:
delta was strong, but price response was weak
price failed to move as much as expected
aggressive pressure may have been absorbed
the market may be interacting with a liquidity wall
The stronger the inefficiency, the more aggressively the candle is highlighted.
This helps you quickly identify bars where:
the effort was high, but the result was weak.
🔸 Absorption Logic
Liquidity Walls uses a regression-style model to estimate the expected price move from delta.
It calculates:
lower timeframe signed volume
net delta
actual movement in ticks
expected movement in ticks
difference between expected and actual movement
When the difference becomes statistically extreme, the indicator treats that candle as a potential absorption event.
In simple terms:
Strong delta + weak price response = possible absorption.
🔸 Liquidity Wall Zones
When absorption is detected, the indicator creates a projected liquidity zone.
If buy-side aggression is absorbed, a zone is drawn above price.
If sell-side aggression is absorbed, a zone is drawn below price.
These zones represent areas where price may have interacted with significant opposing liquidity.
absorbed buying can suggest overhead liquidity
absorbed selling can suggest downside liquidity
zones remain active until price invalidates them
invalidated zones fade automatically
This allows you to visually track areas where the market previously struggled to move through pressure.
🔸 Active Zone Tracking
Liquidity zones extend forward until price breaks through them.
When price clears a zone, the indicator:
stops extending the box
fades the visual appearance
removes it from the active liquidity wall list
This keeps the chart focused on currently relevant liquidity zones instead of cluttering the screen with old levels.
🔸 Granularity Selection
The indicator allows you to choose the lower timeframe source used for delta reconstruction.
Available granularity options include:
1-Minute
1-Second
1-Tick
Lower granularity can provide more detailed flow analysis when data is available.
Important Note
Lower timeframe accuracy depends on the symbol, exchange, TradingView plan, and available historical data. Tick and second-based data may not be available on all markets.
🔹 How the model works
The script looks at the relationship between:
net delta
price movement in ticks
recent correlation between delta and price movement
recent volatility of both delta and price movement
From this, it estimates how far price should have moved based on the current delta.
Then it compares that expected move to the actual move.
If price dramatically underperforms relative to delta, the script marks the candle as inefficient and creates a potential liquidity wall.
🔹 How to read it
🔸 Highlighted candles
Highlighted candles suggest inefficient price movement.
This means aggressive flow entered the market, but price did not respond normally.
Possible interpretations:
absorption
hidden liquidity
exhaustion
trapped aggression
failed continuation
🔸 Liquidity walls above price
A zone above price can suggest that aggressive buying was absorbed.
This may indicate:
overhead liquidity
resistance from passive sellers
buyers pushing into supply
possible failed breakout conditions
🔸 Liquidity walls below price
A zone below price can suggest that aggressive selling was absorbed.
This may indicate:
downside liquidity
support from passive buyers
sellers pushing into demand
possible failed breakdown conditions
🔹 Example interpretations
strong buy delta + weak upward movement → buying may be absorbed
strong sell delta + weak downward movement → selling may be absorbed
price returns to a liquidity wall → possible reaction area
price breaks through a wall → zone is invalidated
multiple inefficient candles near the same level → potential liquidity cluster
🔹 Why this indicator is useful
Liquidity Walls helps shift your analysis from:
“price moved here”
to:
“how did price respond to the pressure behind the move?”
This is useful because not all movement is equal.
Sometimes large aggressive volume creates a clean directional move.
Other times, large aggressive volume gets absorbed and price barely moves.
This indicator is designed to highlight those moments.
🔹 Best use cases
spotting absorption near highs and lows
identifying weak breakouts
tracking potential liquidity clusters
finding areas where aggressive traders may be trapped
confirming failed continuation attempts
adding order-flow context to price action
analyzing reaction zones around key levels
🔹 Inputs you can customize
Granularity
Inefficient candle coloring
Liquidity cluster color
🔸 Granularity
Controls which lower timeframe data is used to estimate signed volume and delta behavior.
🔸 Show Inefficient Candles
Turns candle coloring on or off.
When enabled, candles are colored based on the strength of the inefficiency signal.
🔸 Liquidity Cluster Color
Controls the color used for liquidity walls, inefficient candles, and projected absorption zones.
🔹 Important Notes
This script uses lower timeframe data to approximate aggressive buying and selling activity.
This means:
accuracy depends on available lower timeframe data
results may vary between markets
tick and second data may not be available everywhere
the model is interpretive, not predictive
zones should be used as context, not standalone signals
Liquidity Walls does not predict the future.
It identifies areas where recent order-flow pressure did not produce the expected price response.
That information can help traders better understand where liquidity may be absorbing movement.
🔹 Closing Notes
Liquidity Walls is built to visualize the relationship between aggression, efficiency, and absorption .
It helps reveal when the market is moving cleanly — and when price is struggling against hidden liquidity.
As always, thank you TradingView! 指標

Liquidity Sweep Intelligence - ML Post-Sweep [Dots3Red]█ LIQUIDITY SWEEP INTELLIGENCE — KNN POST-SWEEP
Usually, a liquidity indicator shows where the price is likely to go to take liquidity. This one tells you what tends to happen after it gets there.
When price sweeps a swing high or low — triggering the stop orders sitting there — we face the immediate question: does it reverse (a stop hunt, fade the move) or does it continue (a genuine breakout)? The answer depends on context. This script tracks every historical sweep on your chart, records the contextual features at the moment it happened, and uses a KNN (K-Nearest Neighbors) model to find the most similar past sweeps and return their actual measured outcomes.
The probability shown is not derived from a formula. It is counted from real historical sweeps on your chart.
█ HOW IT WORKS
1. Pool Detection
Swing highs and swing lows are detected using two pivot lengths — a primary (default 10 bars each side) and a secondary (default 8 bars each side) — to capture both major and minor liquidity levels. Same-side pivots that form within the Equal-Level Tolerance % of each other are merged into a single stronger pool, marked with the ⊜ symbol. These are equal highs (EQH) or equal lows (EQL) — two peaks or two troughs at nearly the same price — which represent a higher concentration of stop orders than a single pivot.
Unswept pools are shown as lines on the chart: dashed for single pivots, solid for equal-level pools. Pools expire after the configured maximum age (default 50 bars) without generating a sweep record.
2. Sweep Detection
A sweep is registered when the close price exceeds a pool level by more than the Sweep Buffer (default 1.4 × ATR). This buffer filters out minor wicks that barely touch a level and requires a genuine close beyond it.
At the moment of the sweep, the script records:
• The direction (high swept or low swept)
• Whether the pool was an equal-level cluster (EQH/EQL)
• How old the pool was in bars
• The current ATR ratio (current volatility relative to the 50-bar baseline)
• Whether the sweep occurred inside an ICT killzone window
3. Outcome Measurement
After the Outcome Window (default 10 bars), the script measures what price actually did. For a swept high, it calculates how far price retraced downward and how far it continued upward, both expressed in ATR units. For a swept low, the directions are reversed. If the retracement exceeded the Reversal Threshold (default 3.5 × ATR), the sweep is classified as a reversal. Otherwise it is classified as a continuation. The result is stored in the KNN training data.
4. KNN Inference
The K-Nearest Neighbors model uses a 5-feature vector for each sweep:
• sweep_dir — was a high swept (1) or a low swept (0)?
• age_norm — how old was the pool when swept, normalized 0–1
• is_equal — was it an EQH/EQL cluster (1) or single pivot (0)?
• atr_ratio_norm — current ATR divided by 50-bar ATR baseline, capped at 3×
• in_kz — did the sweep occur inside a killzone window (1) or not (0)?
For each active sweep, the model computes the Euclidean distance to every recorded historical sweep in the training window, finds the K nearest matches (default 15), and returns three values averaged across those neighbors:
• Reversal probability — what percentage of matched sweeps reversed
• Average reversal distance — how far the reversal moved in ATR units
• Average continuation distance — how far the continuation moved in ATR units
The KNN runs every third bar per event for performance. Output is displayed only after the minimum training threshold (default 20 samples) has been reached.
5. Killzone Context
Four ICT killzone windows are tracked in New York time and used as a contextual feature in the KNN vector:
• Asia KZ — 20:00 to 00:00
• London Open KZ — 02:00 to 05:00
• NY Open KZ — 07:00 to 10:00
• London Close KZ — 10:00 to 12:00
Sweeps that occur inside a killzone are marked with ⚡ in the label. The active killzone is also shown in the dashboard.
█ READING THE LABEL
Each active sweep displays a label at the right edge of the chart:
▲ HIGH SWEPT ⊜ ⚡
Rev 68% | +1.4 ATR | N=47
▲ HIGH SWEPT — a swing high was swept (sell-side stops triggered)
⊜ — the pool was an equal-high cluster (stronger stop concentration)
⚡ — the sweep occurred inside a killzone window
Rev 68% — 68% of the 47 matched historical sweeps reversed
+1.4 ATR — the average reversal distance among those that reversed
N=47 — 47 historical sweeps matched this context
Label color follows sweep direction: orange-red for a swept high (bearish sweep), cyan for a swept low (bullish sweep).
While training data is still being collected, the label shows: Training… (8/20 needed)
█ LIQUIDITY VOID ZONE
When a sweep candle has a long wick, there is a gap between the wick extreme and where price actually closed. This zone — where price moved through too fast for normal order flow — is drawn as a semi-transparent dashed box. It represents an imbalance that price frequently returns to fill. The void is colored by sweep direction.
█ DASHBOARD
The top-right table shows:
• Session KZ — which killzone is currently active, if any
• ATR Ratio — current ATR relative to the 50-bar baseline (amber above 1.5×)
• KNN Training — progress bar showing recorded sweep outcomes vs maximum
• Overall Rev % — total reversal rate across all recorded sweeps on this chart
• Avg Rev Dist — average reversal move in ATR across all reversals
• Avg Cont Dist — average continuation move in ATR across all continuations
• Active Pools — number of unswept pools tracked, with EQH/EQL count
• Pending Sweeps — sweeps waiting for their outcome window to complete
• Resolved — count of confirmed reversals and continuations
• KNN Features — reminder of the five features used in the model
█ SETTINGS
Pool Detection
• Primary Pivot Length (10) — bars each side to confirm a major swing
• Secondary Pivot Length (8) — bars each side for minor swings; 0 disables
• Max Tracked Pools (60) — cap on active pools; oldest removed when exceeded
• Max Pool Age (50 bars) — pools older than this are expired without recording
• Equal-Level Tolerance % (3.0) — proximity threshold for EQH/EQL merging
Sweep Settings
• Sweep Buffer (1.4 × ATR) — minimum close beyond pool to register a sweep
• Outcome Window (10 bars) — measurement window after each sweep
• Reversal Threshold (3.5 × ATR) — minimum retracement to classify as reversal
• Show Liquidity Void Zones — toggle the wick imbalance boxes
• Max Historical Sweeps Shown — cap on how many past events are displayed
KNN Engine
• K Neighbors (15) — historical sweeps to average; higher = smoother, slower to adapt
• Max Training Samples (400) — rolling window; oldest samples dropped when exceeded
• Min Samples Before Display (20) — KNN output hidden until this threshold is reached
• ATR Baseline Period (50) — period for the baseline ATR used in the volatility feature
█ TIMEFRAME
Works on any intraday timeframe. Most useful at 5-minute through 1-hour where enough sweeps accumulate to build meaningful training data within a single session. On daily charts, the training window fills slowly but the signals tend to be higher quality.
The KNN model relearns continuously as new sweeps are recorded and old ones fall outside the rolling window. It adapts to the instrument and timeframe it is applied to.
█ NOTES
The reversal probability reflects historical behavior on this chart and timeframe. It is not a forward guarantee. A sweep with Rev 70% still continues 30% of the time. Use the N count as a confidence indicator — higher N means more matched examples and a more reliable estimate.
The model requires at least 20 sweep outcomes before displaying predictions. On timeframes with infrequent sweeps, this may take time to accumulate.
█ DISCLAIMER
This script is a visualization and analytical tool. It does not generate trade signals and does not constitute financial advice. Past sweep behavior does not guarantee future outcomes. 指標

Liquidity PoolsThis script is an automated liquidity mapping tool based on ICT concepts. It actively hunts your chart for zones where retail stop losses and pending breakout orders are clustered.
Here is a breakdown of how the script functions and visualizes liquidity on your chart:
1. Automatic Pivot Detection (Old Highs & Old Lows)
The script continuously monitors price action to find major structural turning points (swing highs and swing lows).
When a confirmed swing high forms, it registers it as Buy-Side Liquidity (BSL) and draws a blue line projecting to the right. This marks a zone where retail traders have placed their buy-stop loss orders above the high.
When a confirmed swing low forms, it registers it as Sell-Side Liquidity (SSL) and draws a red line projecting to the right. This marks a zone where sell-stop loss orders are resting.
2. Equal Highs (EQH) and Equal Lows (EQL) Detection
In ICT methodology, the most powerful magnets for price are "Relative Equal Highs" or "Relative Equal Lows".
The script actively measures the distance between a newly formed pivot and an old active pivot.
If a new pivot forms within a few ticks of an old one (customizable in settings), the script recognizes it as highly engineered liquidity!
It automatically thickens the line, changes its color to bright orange, and updates the text label to EQH or EQL, signaling an extremely high-probability draw on liquidity.
3. Smart Text Labeling
To ensure you never have to guess what a line means, the script pins a text label (BSL, SSL, EQH, or EQL) directly at the starting point of every liquidity pool.
4. Sweep Detection & "Stop-Hunting" Tracking
Liquidity pools are only valid until they are traded through.
The script tracks every live tick. The exact moment price sweeps through a liquidity line, it stops extending the line.
It drops a small "X" right where the line was broken. This gives you a permanent historical footprint on your chart of exactly where and when "Smart Money" swept stops.
5. Memory Management
Because liquidity lines could theoretically build up infinitely and crash your chart, the script has built-in garbage collection. It only keeps track of the 15 most recent unswept pools (you can change this number in the settings) so your chart always stays clean and fast. 指標

Liquidity & Structure Toolkit [erdensedat] The Liquidity & Structure Toolkit is a comprehensive, all-in-one indicator designed for Smart Money Concepts (SMC), Volume Profile analysis, and overall market structure tracking. It aims to provide traders with a clear visual representation of liquidity zones, structural breaks, session balances, and high-volume nodes without cluttering the chart.
Below is a detailed breakdown of all the features, the math and logic behind the setups, the signal engine, and the alert systems included in this script.
1. Major Targets (Liquidity Pools - BSL/SSL)
The script identifies major structural high and low points that act as liquidity magnets (Buy Side Liquidity - BSL and Sell Side Liquidity - SSL).
Formula & Logic: It uses the ta.pivothigh() and ta.pivotlow() functions. A "Major Target" is confirmed only when the price forms a peak/valley with a user-defined Pivot Sensitivity (default is 10 bars on the left and right).
Visualization: When a major pivot is formed, a horizontal line and a label ("MAJOR BSL" or "MAJOR SSL") are drawn.
Sweep Mechanics: If the price crosses this level later, the level is considered "swept." The solid line turns into a dashed line with lower opacity, indicating that the liquidity has been taken. Swept levels are automatically removed after 24 hours to keep the chart clean.
2. Market Structure Breaks (BOS / CHoCH)
This module tracks internal and external structural shifts based on fractal highs and lows.
Logic: It calculates short-term pivots using a fractal length (default 5). When the price breaks above a recent pivot high, it's considered an upward break. When it breaks below a pivot low, it's a downward break.
BOS vs. CHoCH: The script intelligently labels the breaks based on the previous trend state. If the trend continues (e.g., up break followed by another up break), it labels it as BOS (Break of Structure). If the direction shifts (e.g., down break followed by an up break), it labels it as CHoCH (Change of Character).
Settings: You can choose whether a break requires a candle close beyond the level (Break = Close Beyond Level) or just a wick.
3. Initial Balance (IB) Box
The Initial Balance represents the price range established during the first specified minutes of a new trading session.
Setup: You define the Session Timeframe (e.g., Daily) and the IB Duration (e.g., the first 60 minutes).
Logic: The script tracks the highest high (IBH) and lowest low (IBL) during that initial window. Once the time window closes, the box extends to the right, serving as a dynamic support/resistance zone for the rest of the session.
Visualization: Highlights the IB High, IB Low, and IB Equilibrium (Midpoint) with clean labels and a customizable background box.
4. Volume Profile & POC Box (Point of Control)
A custom Volume Profile engine that calculates the highest volume node (POC) dynamically using lower timeframe data.
Lower Timeframe (LTF) Data: The script automatically fetches lower timeframe volume data (1m, 5m, 15m, or 60m depending on your chart's timeframe) to build an accurate profile inside a custom array matrix.
Rows/Bins: The session range is divided into horizontal bins (default 60). Volume is distributed among these bins based on where the LTF candles traded.
POC Engine Models:
Model 1 (Active POC): Displays the active, evolving POC of the current session as well as historical POCs from previous sessions. Uses a Hysteresis percentage (default 15%) to prevent the POC line from flickering rapidly; the new volume node must exceed the old POC by X% to shift the level.
Model 2 (Previous POC Focus): Instead of showing the actively changing current POC, it projects the finalized POC from the previous session starting from its original birth point, extending it across the current session as a heavy structural magnet.
Delta Lines: Inside the POC box, it plots the highest volume node and its immediate neighboring nodes (top, mid, bot) to show the thickness of the volume cluster.
5. Price Action & MSB Signal Engine
The script includes an automated signal engine that identifies highly probable reversal setups around the liquidity zones.
Price Action (PA) Signals: Triggered when the price "touches" or sweeps a Major BSL or SSL level, and subsequently prints a valid directional candle (e.g., sweeping SSL and printing a solid green candle that is not a Doji).
MSB (Market Structure Break) Signals: Triggered when the price sweeps a major liquidity level (BSL/SSL) and then creates a confirmed structural break (BOS/CHoCH) in the opposite direction.
Visualization: Triangle shapes are plotted above/below the signal candles (Green for Buy, Red for Sell).
6. Moving Averages & VWAP
For trend filtering and dynamic support/resistance, the toolkit includes optional traditional indicators:
VWAP: Session-based Volume Weighted Average Price.
Customizable MAs: Up to 5 moving averages can be toggled on/off. Supported types include SMA, EMA, WMA, HMA, and VWMA. Each can have its own length and color settings.
7. Alerts System
The indicator features a built-in alert system for the signal engine.
PA Signal Alert: Fires whenever a valid Price Action bounce occurs at a BSL/SSL level.
MSB Signal Alert: Fires whenever a structural reversal is confirmed after a liquidity sweep.
How to use: Create an alert in TradingView, select this indicator, and choose "Any alert() function call".
Disclaimer
This indicator is for educational and analytical purposes only. It does not constitute financial advice or a recommendation to buy or sell any asset. Past performance is not indicative of future results. Trading cryptocurrencies, forex, and stocks carries a high level of risk. Always perform your own backtesting, use proper risk management, and consult with a certified financial advisor before making any trading decisions. 指標

指標

Liquidity Heatmap MTF [JOAT]LIQUIDITY HEATMAP MTF
A weighted multi-timeframe liquidity-zone heatmap that aggregates pivot-based resting liquidity from up to four higher timeframes (1H / 4H / 1D / 1W by default), decays old pivots over a configurable half-life, and projects the resulting hot bins as a right-side colour strip plus optional horizontal lines that extend back across the chart so the key levels are visible on price. Adds an estimated liquidation-level layer on top — the price ranges where leveraged positions get unwound — and warns when price approaches one.
Why MTF aggregation matters
Single-timeframe liquidity maps miss the structural reality that institutional flow operates on multiple horizons simultaneously. A daily pivot high carries more resting liquidity than a 1H pivot high, but both contribute. Liquidity Heatmap MTF lets you turn on / off each of four timeframes (1H, 4H, 1D, 1W) independently and assign each a weight so the contribution to the heatmap is proportional to your conviction about how much that timeframe matters.
Defaults:
1H weight 1.0×
4H weight 1.5×
1D weight 2.5×
1W weight 4.0× (off by default; enable for macro reads)
Pivots are detected in each HTF context using configurable left/right lookbacks. Each pivot contributes intensity proportional to the volume traded on its bar (with optional log compression for instruments that have rare extreme prints).
Decay — half-life modelled
A pivot from 200 bars ago should not contribute equally to today's heatmap. The script applies an exponential decay:
intensity = volume × exp(−ln(2) × age / halfLife)
The Decay Half-Life input (default 180 bars) sets how quickly old pivots fade. After one half-life, an old pivot contributes half as much; after two, a quarter; and so on. This is the principled way to weight history — it never drops contributions discontinuously and it never lets ancient liquidity poison the current read.
Heatmap grid + hot-zone classification
The price range over the visible lookback (configurable, default 500 bars + 2% padding) is divided into N bins (default 60, capped at 200 by Pine's max_boxes_count). Each pivot's decayed intensity is accumulated into the bin closest to its level. Bins are then normalised against the hottest bin and any bin above the Hot Zone Threshold (default 70% of max) is tagged HOT.
The heatmap is rendered as a vertical strip on the right of the chart (configurable width and gap from latest bar) with bins coloured along a deep-ocean blue gradient — cold bins are near-invisible (transparency floor), hot bins are vivid cyan.
Hot-zone projection across chart (JOAT enhancement)
This is the headline visual: the top hot bins are projected back across the chart as horizontal lines (configurable count, default 5) with price labels, extending back a configurable number of bars (default 120). So you do not just see the heatmap as a right-side strip — you see the key levels on the chart at the price levels they actually occupy. Toggleable.
Estimated liquidation levels (the second layer)
On top of the liquidity heatmap, an optional liquidation layer estimates where leveraged positions get stopped out. Each significant HTF pivot extreme gets a projected liquidation level at:
liq_level = pivot ± (ATR × liqPad)
Configurable liqPad (default 0.5 ATR). Configurable caps on liquidation lines above (default 4) and below (default 4) the current price. Lines extend right by a configurable bar count. When price comes within liqAtrMult × ATR of a liquidation line, the !LIQ alert fires and the line is rendered in the accent colour (the only off-family colour in the palette — bright orange).
The liquidation logic is intentionally conservative — pivots provide the structural anchor; the ATR pad is the only configurable variable; lines are capped to avoid clutter.
Dashboard
Monospaced table positionable to any of nine corners. Surfaces:
Active timeframes and their weights.
Total pivots tracked.
Hottest bin price and intensity %.
Hot-zone count.
Liquidation lines above / below current price counts.
Distance (in ATR units) to nearest liquidation line.
Last hot-zone activation with bar-age.
Visual system
Heat strip (toggleable width / gap / transparency).
HOT tags on hottest bins (toggleable).
Optional strip border.
Horizontal hot-zone lines extending back across the chart (toggleable, capped, configurable length).
Liquidation level lines above and below (toggleable, capped).
LIQ labels (toggleable).
A locked Deep Ocean palette (bathypelagic blue gradient on near-black, with the bright orange #FF6B00 reserved exclusively for liquidation warnings) gives the chart a distinct institutional liquidity-map identity.
Alerts
Three alert conditions, each independently controllable, each cooldown-gated:
Hot Zone Activated — fires when a new bin crosses the hot threshold.
Approaching Liq Level — fires when price comes within liqAtrMult × ATR of a liquidation line.
New HTF Pivot Added — fires when a new HTF pivot is detected and added to the cache.
A configurable cooldown (default 8 bars) prevents back-to-back alert spam.
How to read it
Three reads, in order of conviction:
Approaching Liq Level alert — the most actionable single signal. Price is within striking distance of estimated leveraged-position stop-out levels. Liquidations tend to be self-fulfilling on the way in (cascade through stops) and exhaustive at the extreme (no more sellers / buyers left after the cascade).
Multi-timeframe hot zone — when a hot bin is contributed to by more than one HTF, it is by definition more significant. The hot line projections show you which levels are MTF-confluent.
New HTF Pivot in 1D or 1W context — these are the slowest-moving structural events. A new daily or weekly pivot reshapes the heatmap meaningfully.
Suggested settings
Defaults (1H/4H/1D enabled, weights 1.0/1.5/2.5, decay half-life 180, hot threshold 70%) are tuned for intraday-to-swing trading on liquid futures, FX, and crypto. For pure scalping, disable 1D / 1W and raise 1H weight. For pure macro, enable 1W and raise its weight; reduce 1H to 0.5×. The liqPad default 0.5× ATR is conservative — raise to 1.0× for more cautious liquidation projections.
Originality
The implementation — the MTF pivot aggregation pipeline with per-TF weights, the exponential half-life decay model, the bin-grid heatmap with hot-zone threshold, the cross-chart hot-line projection layer, the ATR-based liquidation level estimator with above/below caps, the cooldown-gated multi-alert engine, and the deep-ocean palette with the orange liquidation accent — is JOAT-original. No third-party code reused. The "liquidity map" concept comes from professional desks; the implementation here is purpose-built for Pine v6 with bar data only.
Limitations
Estimated liquidation levels are an inference from pivots and ATR — Pine cannot read actual leverage data or aggregated futures funding/open-interest. The lines mark where stop clusters are statistically likely to sit, not where they actually do. Pine's max_boxes_count caps the grid at 200 bins; the script clamps to 200 max even though the input allows higher requests. MTF pivots use request.security in non-lookahead mode, so they are non-repainting once confirmed at their HTF.
—
-made with passion by jackofalltrades
指標

Strong Weak Highs Lowsstrong Weak Highs & Lows is a market structure indicator that automatically classifies swing points based on price behavior and trend context. Instead of simply plotting highs and lows, it helps traders distinguish between levels that are likely to hold and levels that are more vulnerable to being broken.
The indicator identifies:
* **WH (Weak High)**
* **SH (Strong High)**
* **WL (Weak Low)**
* **SL (Strong Low)**
This provides a clearer view of liquidity, market intent, and potential breakout targets.
Understanding the Labels
Weak High (WH)
A Weak High is a swing high that has a higher probability of being broken in the future.
Characteristics:
* Usually forms during bullish market conditions.
* Indicates buyers remain in control.
* Often becomes a future liquidity target.
Strong High (SH)
A Strong High is a swing high that successfully rejects price and is more likely to hold.
Characteristics:
* Often forms during bearish conditions.
* Indicates seller presence.
* Acts as a potential resistance level.
Weak Low (WL)
A Weak Low is a swing low that has a higher probability of being broken.
Characteristics:
* Common during bearish trends.
* Indicates continued downside pressure.
* Frequently becomes a liquidity target.
Strong Low (SL)
A Strong Low is a swing low that successfully defends against further selling.
Characteristics:
* Often forms during bullish conditions.
* Indicates buyer strength.
* Acts as potential support.
What the Chart Demonstrates
Using the NVIDIA (NVDA) 1H chart:
📈 During bullish phases, the indicator identified multiple **Weak Highs (WH)** while marking **Strong Lows (SL)** beneath price, highlighting continued buyer dominance.
📉 As momentum weakened, **Strong Highs (SH)** began appearing near market turning points, signaling increasing seller control.
🎯 Weak levels often became natural liquidity targets before price reversed or continued its trend.
🔄 The ongoing alternation between strong and weak swing points provides valuable context for anticipating future market structure developments.
Why This Matters
Many traders focus solely on where highs and lows are located.
Professional price action analysis also considers:
* Which highs are likely to be broken
* Which lows are likely to hold
* Where liquidity is resting
* Where stop orders may be clustered
* Which side currently controls market structure
Strong Weak Highs & Lows helps visualize these concepts automatically.
Features
✔ Automatic swing detection
✔ Strong vs Weak classification
✔ Liquidity target identification
✔ Market structure context
✔ Clean chart visualization
✔ Non-repainting swing confirmation
✔ Multi-timeframe support
✔ Suitable for Smart Money Concepts (SMC)
How to Use
Bullish Environment
* Focus on Strong Lows (SL).
* Expect Weak Highs (WH) to be targeted and potentially broken.
* Look for continuation opportunities after pullbacks.
Bearish Environment
* Focus on Strong Highs (SH).
* Expect Weak Lows (WL) to be targeted and potentially broken.
* Look for selling opportunities during retracements.
Liquidity Analysis
* Weak highs and weak lows often act as future liquidity magnets.
* Use them as potential target zones for trend continuation trades.
Best Applications
* Market Structure Trading
* Smart Money Concepts (SMC)
* Liquidity Analysis
* Swing Trading
* Trend Following
* Intraday Trading
* Higher Timeframe Confirmation
Notes
Strong and Weak classifications are based on market structure behavior and are not direct buy or sell signals. The indicator is designed to help traders understand the strength behind swing points and improve decision-making around support, resistance, and liquidity.
For best results, combine with:
* Break of Structure (BOS)
* Change of Character (CHoCH)
* Supply & Demand Zones
* Risk Management Rules
Strong Weak Highs & Lows transforms ordinary swing analysis into actionable market structure insight by identifying which levels are likely to hold and which levels are likely to become future liquidity targets. 指標

Inducement Engine Liquidity Targets [MarkitTick]💡 The financial markets operate as a continuous auction process, constantly seeking liquidity to facilitate large transactions. We have developed a comprehensive analytical tool designed to systematically map these liquidity zones, specifically focusing on the concept of inducement (IDM). This tool tracks market structure in real-time, identifying areas where market participants are structurally trapped, and highlights the subsequent liquidity sweeps that often precede significant directional moves. By mapping these pivot points and applying stringent confluence filters, we provide a structured approach to analyzing price action without relying on lagging, derivative-based oscillators.
✨ Originality and Utility
Standard structural tools often map higher highs and lower lows but fail to categorize the internal liquidity that resides between these structural bounds. Our tool distinguishes itself by isolating inducement points—short-term swing highs or lows that form within an active leg of market structure.
Instead of treating all pivots equally, we categorize them based on their relationship to the overarching trend. Furthermore, this tool does not simply plot historical data; it actively tracks pending liquidity pools and waits for their invalidation to derive actionable zones.
This utility is enhanced by a built-in risk management engine that dynamically calculates entry, stop loss, and multiple take profit voids based on market volatility, offering a complete, end-to-end framework directly on the chart. The integration of volume volatility, exhaustion profiling, and structural imbalances creates a unified, logical system rather than an arbitrary assembly of unrelated indicators.
🔬 Methodology and Concepts
● The Mechanics of Inducement
Market Structure Tracking: We utilize an advanced, non-repainting pivot identification algorithm that maps confirmed structural highs and lows. This establishes the primary directional bias and prevents the plotting of unconfirmed future data.
Pending Liquidity Generation: When an internal pivot forms within the established structural range, it is categorized as a pending inducement point. These represent areas where early market participants place stop losses, creating pools of concentrated liquidity.
The Liquidity Sweep: The core engine monitors price action for the precise moment these inducement points are breached. A sweep indicates that the pending liquidity has been consumed, providing the fuel required for a potential reversal or trend continuation.
Multi-Layered Confluence: A sweep alone is insufficient for validation. We evaluate the trigger against several strict conditions. We require alignment with a higher timeframe trend, ensuring we trade with the dominant macro flow. We also measure volatility against a moving baseline to filter out low-momentum chop.
Exhaustion and Imbalance: Finally, we assess the structural integrity of the move by checking for price exhaustion through rejection wicks and the presence of underlying fair value gaps (FVGs) that validate the momentum.
🎨 Visual Guide
● Chart Elements
Pending IDM Lines: Dotted lines projecting horizontally from internal pivots. These represent untouched liquidity pools waiting to be swept.
IDM Sweep Labels: Distinct visual markers displaying "IDM ↑" and "IDM ↓". These appear exactly when price sweeps a pending liquidity level, signaling a potential reaction.
Entry Zones (Black Boxes): A solid, dark zone originating at the trigger point, highlighting the exact entry threshold for the setup.
Stop Loss Zones (Red Boxes): A colored zone delineating the maximum risk threshold, visually adapting to the current structural invalidation point and volatility padding.
Take Profit Voids (Blue/Cyan Boxes): A series of progressively lighter colored zones representing Take Profit 1, 2, and 3. These voids illustrate the projected risk-to-reward extensions based on the initial risk profile.
Target Lines: Horizontal dashed and dotted lines projecting the exact price levels for the entry, stop loss, and multiple take profit targets.
● The Live Dashboard
Header: Displays the active ticker and timeframe configuration.
Bias: Indicates the overarching structural trend (Bullish, Bearish, or Neutral).
Last IDM: Shows the direction of the most recently swept liquidity pool.
Coordinates: Displays the exact numerical price levels for Entry, TP1, TP2, TP3, and SL.
Duration Tracking: Tracks the exact number of bars since the last confirmed Bull or Bear IDM sweep, offering a measure of setup maturity.
Pending Count: A live counter of the currently active, untouched inducement points on the chart.
📖 How to Use
Observe the dashboard to determine the active market bias and monitor the creation of pending IDM levels.
Wait for price action to sweep a pending IDM line. The appearance of an IDM sweep label serves as the primary catalyst.
Verify that the dashboard registers the setup, meaning all selected smart filters (Time, HTF, Volatility, FVG) are aligned.
Utilize the dynamically plotted Entry, Stop Loss, and Take Profit boxes to structure your position sizing and risk profile.
The projected target voids can be used to manage risk or scale out of positions sequentially as price moves into higher extensions.
Avoid using this indicator in sideways market conditions to prevent false entries.
⚙️ Inputs and Settings
● Core Configuration
Swing Length: Adjusts the sensitivity of the pivot detection. Higher values filter noise, identifying more significant structural points.
ATR Length: Modifies the lookback period for volatility calculations used in risk mapping.
Max IDM Memory: Controls the historical limit for tracking untouched liquidity pools.
● Entry and Risk Parameters
ATR-Adaptive SL: When enabled, we pad the structural stop loss with an average true range multiplier to account for market noise.
ATR SL Mult: Defines the precise multiplier used for the adaptive padding.
Target Multipliers (TP1, TP2, TP3): Defines the precise risk-to-reward ratios for the sequential take-profit voids.
Line Toggles: Independent toggles to show or hide the Entry, Stop Loss, and Target lines to keep the chart clean.
● Smart Filters
Session Time Filter: Restricts signal generation to specific trading windows, avoiding low-liquidity periods.
HTF Trend Alignment: Enforces agreement with a moving average calculated on a higher timeframe.
HTF Timeframe & Length: Configures the resolution and period for the higher timeframe trend filter.
FVG Confluence: Requires a recent fair value gap to validate the momentum behind the setup.
Rejection Quality: Filters setups ensuring the trigger bar closes with distinct rejection characteristics.
Volatility Chop Filter: Suppresses setups when current volatility is below its historical average.
● Visuals and Alerts
Color Configurations: Extensive user-defined color inputs for Bull/Bear markers, Entry Fills, Target zones, and text elements.
Webhook Actions: Dedicated string inputs to format dynamic alert payloads, allowing seamless integration with third-party execution platforms.
🔍 Deconstruction of the Underlying Scientific and Academic Framework
Auction Market Theory: Our architecture is deeply rooted in Auction Market Theory, which postulates that price discovery relies on the continuous search for liquidity. By mapping inducement, we are effectively modeling the algorithmic search for counter-party volume. Markets move from areas of high liquidity to low liquidity, and tracking these pools provides a probabilistic edge.
Mean Reversion within Structural Bounds: The identification of internal sweeps relies on statistical mean reversion. When price deviates aggressively to sweep a pivot, it creates a temporary state of overextension. The subsequent reaction is a reversion to the mean of the macro structure, propelled by the trapped liquidity that was just consumed.
Volatility-Adjusted Risk Modeling: The integration of the Average True Range (ATR) for stop-loss padding utilizes basic heteroskedasticity principles. Financial time series exhibit volatility clustering; by padding risk dynamically, the model adapts to the current state of market variance rather than relying on static, arbitrary tick values that fail in highly volatile environments.
Volume Spread and Exhaustion: The rejection filter incorporates elements of Volume Spread Analysis. A sweep accompanied by price rejection signifies absorption—a scenario where the effort to push price beyond a level is met with overwhelming counter-force, statistically validating the structural trap.
⚠️ Disclaimer
All provided scripts and indicators are strictly for educational exploration and must not be interpreted as financial advice or a recommendation to execute trades. I expressly disclaim all liability for any financial losses or damages that may result, directly or indirectly, from the reliance on or application of these tools. Market participation carries inherent risk where past performance never guarantees future returns, leaving all investment decisions and due diligence solely at your own discretion. 指標

指標

Liquidity Intelligence Entry SystemLiquidity Intelligence System
Liquidity Intelligence System is a liquidity-based market analysis framework designed around one central idea:
market movement is often shaped by liquidity pools, stop sweeps, directional bias, displacement, volatility conditions, and the quality of confluence around a signal.
This script is not designed to mark every candle, every swing, or every possible reversal. It is not intended to behave like a simple buy/sell indicator that reacts to one isolated condition. Its purpose is to detect structured liquidity events, compare multiple confluence models in the background, classify the current market regime, display signal quality, and project a visual risk/reward framework directly on the chart.
The script combines liquidity sweep detection, trend confirmation, FVG presence, volume expansion, RSI extremes, displacement behavior, market regime logic, adaptive preset modes, TP1/TP2/TP3 projection, visual liquidity mapping, and a model-performance dashboard into one organized workflow.
The goal is to help users review liquidity-based signals in a more structured way, not to promise future performance or replace independent analysis.
🔓 PUBLICATION NOTE
This script is published to provide a structured liquidity-analysis workflow.
The description is intentionally detailed because many users do not inspect every part of the Pine Script logic line by line. The purpose of this page is to explain what the script does, how its components connect, why the system is organized this way, and what limitations should be understood before using it.
The script should be treated as a decision-support and research tool. It is not financial advice, it is not an automated trading system, and it does not guarantee profitable results.
📌 OVERVIEW
At a high level, Liquidity Intelligence System does several things:
1. It detects liquidity sweep conditions around recent swing highs and swing lows.
2. It identifies buy-side liquidity and sell-side liquidity areas.
3. It can mark Equal High and Equal Low liquidity pools.
4. It changes swept liquidity levels visually once price takes them.
5. It evaluates 16 different liquidity/confluence signal models in the background.
6. It allows the user to manually choose which model should be active on the chart.
7. It prevents repeated same-direction signals from stacking unnecessarily.
8. It calculates virtual trade outcomes for each model.
9. It displays model statistics such as Trades, Win Rate, Profit Factor, Average R, and Net R.
10. It identifies the current best-performing model according to a selected metric.
11. It detects the current market regime using trend, ADX-style directional movement, ATR behavior, and candle body conditions.
12. It gives the most recent signal a Signal Quality score.
13. It displays a Signal Quality panel with a visual score bar.
14. It projects Entry, TP1, TP2, TP3, and SL levels on the chart.
15. It draws soft reward and risk zones around the active signal.
16. It provides theme modes for different chart styles.
17. It includes dynamic alert messages with signal, model, quality, regime, entry, TP, SL, and performance details.
The script is therefore not a single-purpose liquidity sweep marker. It is a multi-model liquidity intelligence and signal-review framework.
🧠 CORE IDEA
The core idea of the script is that a liquidity sweep by itself is only one part of the story.
A market may sweep a previous high or low, but that does not automatically mean the move is actionable. A sweep can lead to reversal, continuation, expansion, or false movement depending on the broader context.
For that reason, Liquidity Intelligence System does not rely on one condition alone.
Instead, it builds a layered model around the following question:
When liquidity is taken, what other evidence exists around that event?
The system can evaluate liquidity events together with:
- trend direction,
- recent FVG behavior,
- volume expansion,
- RSI extreme positioning,
- displacement strength,
- current market regime,
- and model-specific confluence.
This allows the script to compare different interpretations of the same market environment.
For example, one user may prefer simple liquidity sweeps, while another may prefer liquidity sweeps only when FVG and trend alignment are also present. The script does not force one fixed interpretation. It allows multiple models to run in the background while the user selects the model they want to display.
🧩 WHY THIS SCRIPT IS NOT A SIMPLE MASHUP
This script combines several concepts that are familiar in technical analysis and liquidity-based trading:
- swing highs and swing lows,
- liquidity sweeps,
- equal highs and equal lows,
- FVG-style imbalance logic,
- trend filters,
- volume filters,
- RSI conditions,
- displacement candles,
- ATR-based risk projection,
- dashboard statistics,
- alert messages.
These individual concepts are not unique by themselves.
The main purpose of this script is the way these elements are organized into one structured liquidity workflow:
Liquidity map
→ sweep detection
→ confluence model selection
→ market regime classification
→ signal quality scoring
→ TP1/TP2/TP3 projection
→ model-performance dashboard
→ dynamic alert system
Each part has a specific role.
- The liquidity map shows where price may be interacting with stop pools.
- The sweep engine defines the base signal event.
- The confluence models decide which extra filters should be required.
- The regime engine gives context about the current environment.
- The quality panel summarizes the last signal.
- The dashboard compares the performance of different models.
- The TP/SL projection gives a visual review structure.
- The alert system allows monitoring without constantly watching the chart.
For that reason, the script is intended as one complete liquidity-intelligence framework, not as a random collection of unrelated tools.
💧 WHAT THE SCRIPT DOES
The script begins by detecting swing-based liquidity references.
It uses recent pivot highs and pivot lows to define potential buy-side and sell-side liquidity levels.
Then it can classify and draw:
- BSL: Buy-Side Liquidity
- SSL: Sell-Side Liquidity
- EQH: Equal High liquidity
- EQL: Equal Low liquidity
When price later trades through one of these mapped levels, the script can visually mark that level as swept. This makes the liquidity map more informative because old untouched levels and swept levels are no longer displayed the same way.
After the liquidity engine identifies sweep conditions, the script evaluates whether the sweep qualifies under one of the available model combinations.
Those models are tested in the background, while the user chooses which one should be active on the chart.
The active model controls the visible LONG / SHORT labels and the projected Entry / TP / SL structure.
⚙️ HOW THE SCRIPT WORKS
1) LIQUIDITY SWEEP ENGINE
The script uses swing pivots to identify important recent highs and lows.
A buy-side sweep occurs when price moves above a previous swing high and then closes back below that swing high.
A sell-side sweep occurs when price moves below a previous swing low and then closes back above that swing low.
The script also checks sweep depth and wick rejection. This helps avoid treating every small break of a level as an equally meaningful sweep.
The sweep engine uses:
- swing pivot length,
- maximum sweep depth measured with ATR,
- rejection wick ratio,
- current candle structure,
- and the most recent mapped swing levels.
This base liquidity engine creates the foundation for all model combinations.
2) BSL / SSL LIQUIDITY MAP
The script can draw liquidity levels directly on the price chart.
The map may include:
- BSL above swing highs,
- SSL below swing lows,
- EQH when similar highs form near each other,
- EQL when similar lows form near each other.
The liquidity map is designed to be selective rather than excessive.
A quality mode controls how many levels are displayed:
- Balanced: more levels,
- Conservative: cleaner default view,
- Strict: fewer but more selective levels.
The script also limits the maximum number of active liquidity lines so the chart does not become overloaded.
3) SWEPT LIQUIDITY VISUAL STATE
When price reaches a mapped liquidity level, the script can mark that line as swept.
A swept liquidity line changes visually:
- the line becomes grey,
- the style changes,
- the label changes to SWEPT.
This makes it easier to distinguish active liquidity pools from liquidity that has already been taken.
This visual behavior is important because liquidity levels are not static forever. Once price has interacted with a level, its meaning may change.
4) EQUAL HIGH / EQUAL LOW LOGIC
The script can detect similar high or low points using an ATR-based tolerance.
Equal highs can represent a potential buy-side liquidity pool.
Equal lows can represent a potential sell-side liquidity pool.
Because instruments have different volatility, the tolerance is not fixed in raw price terms. It is scaled with ATR.
This makes the EQH / EQL logic more adaptive across different markets and timeframes.
🧠 16 MODEL SYSTEM
The script includes 16 model combinations.
These models are evaluated in the background:
1. LQ
2. LQ + Trend
3. LQ + FVG
4. LQ + Volume
5. LQ + RSI
6. LQ + Displacement
7. LQ + Trend + FVG
8. LQ + Trend + Volume
9. LQ + Trend + RSI
10. LQ + Trend + Displacement
11. LQ + FVG + Volume
12. LQ + FVG + RSI
13. LQ + FVG + Displacement
14. LQ + Volume + RSI
15. LQ + Trend + FVG + Volume
16. LQ + Trend + FVG + Volume + RSI + Displacement
The user can choose one active model from the settings.
The active model is the one that controls the visible chart signals.
The other models still run in the background for dashboard comparison.
This is one of the main ideas of the script: the user does not have to guess which confluence combination is currently performing better. The dashboard can compare the models over the visible historical calculation period.
📈 TREND COMPONENT
The trend component compares a fast EMA and a slow EMA.
If the fast EMA is above the slow EMA, the script treats the trend condition as bullish.
If the fast EMA is below the slow EMA, the script treats the trend condition as bearish.
This does not mean the EMA lines have to be plotted on the chart. They can work silently as internal filters.
When a model uses Trend, the liquidity signal must align with the EMA-based directional condition.
🟩 FVG COMPONENT
The FVG component checks for recent imbalance-style behavior.
The script identifies bullish and bearish FVG-style conditions and then checks whether such a condition has occurred within a recent lookback window.
This allows models such as:
- LQ + FVG,
- LQ + Trend + FVG,
- LQ + FVG + Volume,
- LQ + FVG + Displacement,
to require liquidity behavior together with recent imbalance context.
The FVG logic in this version is used as a filter and confluence component. It is not presented as a full FVG box-management system.
🔊 VOLUME COMPONENT
The volume component compares current volume against a volume moving average.
When current volume exceeds the selected volume average by the chosen multiplier, the script treats it as a volume expansion condition.
This can help models focus on sweeps that occur with stronger activity.
Volume is not used as proof of future direction. It is used as one additional context layer.
📉 RSI COMPONENT
The RSI component allows the script to include oscillator conditions in selected models.
For long models, RSI can be required to be near or below a selected lower threshold.
For short models, RSI can be required to be near or above a selected upper threshold.
This allows RSI to function as a contextual filter around liquidity events rather than as a standalone signal generator.
⚡ DISPLACEMENT COMPONENT
The displacement component checks whether the signal candle has enough body strength relative to ATR and total candle range.
A bullish displacement condition requires:
- bullish candle body,
- minimum body size relative to ATR,
- minimum body ratio inside the candle range.
A bearish displacement condition uses the opposite candle direction.
This helps identify signals where the sweep is followed by stronger directional candle behavior.
🧠 MARKET REGIME DETECTION
The script includes a market regime engine.
It classifies the current environment into states such as:
- Trend Up
- Trend Down
- Range
- Choppy
- High Vol
- Low Vol
- Neutral
The regime engine uses:
- directional movement logic,
- ADX-style trend strength,
- EMA trend direction,
- ATR compared to its average,
- candle body ratio behavior.
The purpose of this engine is to provide context.
A liquidity sweep in a trending market is not the same as a liquidity sweep in a range.
A signal during choppy conditions may require more caution than a signal during clean directional expansion.
The regime output is also used in the Signal Quality framework.
⭐ SIGNAL QUALITY SCORE
The Signal Quality score is a 0–100 style scoring framework.
The score is designed to summarize the most recent signal’s contextual quality.
It can consider:
- whether the signal is a valid liquidity event,
- whether the selected model’s trend condition is satisfied,
- whether the selected model’s FVG condition is satisfied,
- whether the selected model’s volume condition is satisfied,
- whether the selected model’s RSI condition is satisfied,
- whether the selected model’s displacement condition is satisfied,
- whether the market regime supports or conflicts with the signal direction.
The important detail is that the score is connected to the active model.
For example:
If the active model is LQ + FVG, FVG matters more directly.
If the active model is LQ + Volume, volume matters more directly.
If the active model is LQ + Trend + FVG + Volume, all of those conditions become part of the model-specific score.
This helps avoid a generic score that ignores the selected model’s logic.
📊 SIGNAL QUALITY PANEL
The Signal Quality panel displays a compact summary of the last signal.
It can show:
- current regime,
- market bias,
- last signal side,
- active model,
- signal score,
- mini score bar,
- alignment state.
The score bar is included to make the quality reading easier to review visually.
Example format:
Score: 78/100
Bar: ████████░░
This panel is not intended to guarantee that a signal will work. It simply summarizes how much contextual evidence was present when the signal appeared.
📊 MODEL DASHBOARD
The main dashboard compares the 16 models.
It includes:
- Trades
- WR
- PF
- Avg R
- Net R
- Active model row
- Best system row
The dashboard is meant for internal review.
It does not represent broker-executed trades. It is a virtual model-testing layer based on the script’s signal and TP/SL rules.
The dashboard helps the user compare whether one model is currently producing cleaner historical behavior than another, but it should not be interpreted as a guarantee that the same behavior will continue.
🏆 BEST SYSTEM ROW
The script can identify a Best System based on the selected metric.
The user can choose the best-system metric from:
- Net R
- Profit Factor
- Average R
- Win Rate
The system also uses a minimum trade count before a model can qualify for the Best row.
This is important because a model with only one or two trades can look misleading. The minimum trade threshold helps reduce the chance of highlighting a model with too little sample size.
🎛️ PRESET MODES
The script includes preset modes.
Available presets:
- Manual
- Scalping
- Intraday
- Swing
- Conservative
- Aggressive
- Funded Account Safe
The default preset is Intraday.
Preset modes do not simply change the name of the setting. They adjust internal effective values such as:
- TP / SL behavior,
- maximum bars in trade,
- sweep depth sensitivity,
- rejection requirement,
- FVG recency,
- volume multiplier,
- displacement requirements.
Manual mode allows the user to control the underlying settings directly.
Presets are included to make the script easier to adapt to different trading styles without requiring every setting to be adjusted one by one.
🎨 THEME SYSTEM
The script includes three visual themes:
Emerald Dark
A dark premium style using green and teal accents.
Crimson Pro
A more aggressive dark theme using red and high-contrast signal colors.
Ice Minimal
A cleaner light-style theme with black text and softer blue/grey visual structure.
The theme affects visual elements such as:
- dashboard colors,
- selected model row,
- best-system row,
- TP/SL/Entry line colors,
- TP/SL/Entry labels,
- reward and risk boxes.
The purpose is to make the same system usable across different chart backgrounds and visual preferences.
🎯 ACTIVE TRADE PROJECTION
When the active model produces a new signal, the script can project a visual trade framework.
The chart may display:
- Entry line
- TP1 line
- TP2 line
- TP3 line
- SL line
- reward zone
- risk zone
- price labels next to each level
The projected levels are based on risk multiples.
Default structure:
- TP1 = 1R
- TP2 = 2R
- TP3 = 3R
- SL = 1R risk
The user can adjust TP1, TP2, and TP3 R multiples from settings.
The projected structure is designed for review and visualization. It should not be treated as an instruction to enter a live trade without additional analysis and risk management.
🟢 TP / SL BACKTEST LOGIC
The script’s virtual testing engine is aligned with the TP1 / TP2 / TP3 structure.
If TP3 is reached, the virtual result is recorded using the selected TP3 R multiple.
If SL is reached, the result is recorded as -1R.
If the trade expires before TP3 or SL, the script can use the highest reached TP level or the open R result depending on what happened.
This creates a more consistent link between what appears visually on the chart and what the dashboard is evaluating.
Same-bar TP/SL behavior is handled by a conservative option. If both TP and SL appear to be hit during the same candle, the user can choose to count that situation conservatively.
🔁 NO CONSECUTIVE SAME-DIRECTION SIGNALS
The script includes a same-direction signal filter.
If a model produces a long signal, it will not keep printing long signals repeatedly until an opposite short signal occurs.
Likewise, if a model produces a short signal, it will not keep printing short signals repeatedly until an opposite long signal occurs.
This helps reduce repeated label clutter and makes the signal stream easier to review.
🚨 PRO ALERT SYSTEM
The script includes dynamic alert messages.
The alert message can include:
- signal side,
- active model,
- preset mode,
- quality score,
- market regime,
- alignment,
- entry price,
- TP1,
- TP2,
- TP3,
- SL,
- active model WR,
- active model PF,
- active model Avg R,
- active model Net R.
The script supports Text and JSON-style alert formats.
Important usage note:
To use the full dynamic Pro Alert message, create the TradingView alert with:
Condition: Liquidity Intelligence System
Option: Any alert() function call
The regular alertcondition messages are fallback static alerts.
🧭 WHAT APPEARS ON THE CHART
Depending on settings, the script may display:
- LONG / SHORT labels,
- BSL liquidity lines,
- SSL liquidity lines,
- EQH liquidity lines,
- EQL liquidity lines,
- SWEPT liquidity labels,
- Entry line,
- TP1 line,
- TP2 line,
- TP3 line,
- SL line,
- reward area box,
- risk area box,
- price labels beside Entry / TP / SL,
- main model dashboard,
- Signal Quality dashboard.
This design is intentional.
The chart shows liquidity structure, active model signals, projected risk/reward, and review statistics in one organized view.
🧪 HOW TO USE THE SCRIPT
A practical workflow:
1. Add the script to your chart.
2. Start with the default Intraday preset.
3. Choose a theme that fits your chart background.
4. Select the active model you want to display.
5. Review the liquidity map: BSL, SSL, EQH, and EQL.
6. Wait for a liquidity sweep signal from the active model.
7. Check the Signal Quality panel.
8. Check the market regime and alignment state.
9. Review the Entry / TP1 / TP2 / TP3 / SL projection.
10. Compare the active model to the other models in the dashboard.
11. Use alerts if you want to monitor signals automatically.
12. Validate settings across the specific instruments and timeframes you actually trade.
The script is best used as a structured review framework, not as a blind execution system.
⚙️ SETTINGS REFERENCE
Manual Model Selection
- Active Signal Model: selects which of the 16 models appears on the chart.
- Preset Mode: selects the effective behavior profile.
- Show Active Model Labels: enables/disables signal labels.
- Signal Label Style: controls how much information appears in signal labels.
- LONG / SHORT Label Size: controls signal label size.
Virtual Trade Test
- ATR Length: ATR basis for risk calculations.
- Virtual TP ATR Multiplier: used in manual/preset logic where applicable.
- Virtual SL ATR Multiplier: used to define risk distance.
- TP1 R Multiple: first target multiple.
- TP2 R Multiple: second target multiple.
- TP3 R Multiple: third target multiple.
- Max Bars In Virtual Trade: maximum duration of virtual trade.
- If TP and SL Hit Same Candle, Count As Loss: conservative same-bar handling.
Liquidity Sweep
- Swing Pivot Length: pivot sensitivity.
- Max Sweep Depth ATR: maximum allowed sweep depth.
- Minimum Rejection Wick Ratio: wick rejection requirement.
- Show BSL / SSL Liquidity Lines: enables liquidity map.
- Show Equal High / Equal Low Lines: enables EQH/EQL.
- Liquidity Line Limit: maximum active liquidity lines.
- Liquidity Map Quality: controls how selective the liquidity map is.
- Equal High / Low Tolerance ATR: ATR-scaled equality tolerance.
Confirmation Filters
- Fast EMA Length: trend filter fast EMA.
- Slow EMA Length: trend filter slow EMA.
- EMA Source: source used for EMA calculations.
- Minimum FVG Size ATR: minimum FVG size filter.
- FVG Recent Bars: how recently FVG must have appeared.
- Volume SMA Length: volume baseline.
- Volume Spike Multiplier: volume expansion threshold.
- RSI Length: RSI calculation length.
- RSI Long Threshold: RSI condition for long models.
- RSI Short Threshold: RSI condition for short models.
- Minimum Displacement Body ATR: minimum displacement body size.
- Minimum Displacement Body Ratio: minimum body-to-range ratio.
Market Regime & Quality
- Show Signal Quality Table: enables/disables quality panel.
- Regime ADX Length: directional movement calculation length.
- Trend ADX Threshold: trend-strength threshold.
- Range ADX Threshold: range-condition threshold.
- Regime ATR Average Length: ATR baseline for volatility regime.
- High Volatility ATR Multiplier: high-volatility threshold.
- Low Volatility ATR Multiplier: low-volatility threshold.
- Choppy Body Ratio Threshold: body-ratio condition for choppy regimes.
Dashboard & Visuals
- Show Model Dashboard: enables/disables model comparison dashboard.
- Theme: selects Emerald Dark, Crimson Pro, or Ice Minimal.
- Dashboard Size: controls dashboard text size.
- BEST System Metric: selects best-system ranking logic.
- Minimum Trades For BEST Row: minimum sample size for best-system qualification.
Pro Alerts
- Enable Pro Alert Message: enables dynamic alert messages.
- Alert Message Format: selects Text or JSON-style format.
🧠 WHAT MAKES THIS SCRIPT ORIGINAL
This script uses familiar components such as swing highs/lows, EMA trend filters, volume comparison, RSI thresholds, ATR, and dashboard statistics.
Those components are not original by themselves.
The originality of this script lies in how those components are organized into a single liquidity-intelligence workflow:
Liquidity map
→ sweep detection
→ 16 model comparison
→ market regime classification
→ model-specific quality scoring
→ TP1/TP2/TP3 projection
→ dashboard review
→ dynamic alert output
This structure allows the script to function as a complete liquidity review environment rather than a simple signal marker.
⚠️ IMPORTANT PRACTICAL NOTES
The script’s behavior depends heavily on settings.
Signal frequency and signal quality may change based on:
- selected active model,
- preset mode,
- pivot length,
- sweep depth,
- rejection requirement,
- FVG recency,
- volume threshold,
- RSI thresholds,
- displacement settings,
- volatility conditions,
- symbol,
- timeframe.
A model that looks cleaner on one instrument may not behave the same way on another.
The dashboard is a virtual review layer. It is useful for comparing model behavior, but it should not be treated as proof of future results.
⚠️ LIMITATIONS AND SHORTCOMINGS
This script has important limitations:
- It does not guarantee profitable signals.
- It does not know future price movement.
- It does not replace risk management.
- It does not execute trades.
- It does not include broker slippage, commissions, spreads, or order-fill uncertainty.
- It uses chart data and bar-based logic.
- Same-bar TP/SL ambiguity is handled by a rule, not by true intrabar reconstruction.
- Liquidity sweeps can fail.
- FVG, trend, volume, RSI, and displacement filters can still produce false signals.
- The dashboard is historical and virtual, not a live brokerage performance report.
- Market regime classification is an analytical approximation, not an absolute truth.
- No confluence model removes all risk or uncertainty.
For these reasons, the script should be used as a structured analysis and review tool, not as a standalone trading system.
👤 WHO THIS SCRIPT MAY BE USEFUL FOR
This script may be useful for traders who:
- study liquidity sweeps,
- use smart-money-style market structure concepts,
- want BSL / SSL / EQH / EQL mapping,
- want multiple confluence models in one tool,
- want a visual TP1 / TP2 / TP3 framework,
- want a signal quality panel,
- want market regime context,
- want model comparison statistics,
- prefer organized chart-based review.
It may be less suitable for users who:
- want a fully automated trading system,
- want guaranteed buy/sell signals,
- do not use liquidity concepts,
- do not want dashboard-based review,
- prefer very minimal charts with no overlays,
- expect one model to work the same way on every market and timeframe.
🛡️ DISCLAIMER
This script is provided for educational and informational purposes only.
It does not constitute financial, investment, or trading advice.
No indicator can guarantee future results. Market conditions change, historical behavior does not ensure future behavior, and every user is responsible for their own analysis, validation, position sizing, and risk management.
Use this script as a structured decision-support and review framework, not as a promise of profitability.
指標

Liquidity Cartography [JOAT]JOAT Liquidity Cartography
Introduction
JOAT Liquidity Cartography is an open-source liquidity mapping overlay built to organize where price has swept obvious pools, where imbalance still exists, and where repricing blocks remain active.
It combines prior-day and prior-week references, equal-high and equal-low clustering, sweep-state persistence, displacement logic, imbalance arrays, repricing block arrays, and confluence scoring.
The problem it solves is fragmented liquidity analysis.
Many traders watch prior highs and lows separately from fair value gaps, separately from equal highs and lows, and separately from displacement.
This script turns those references into one coordinated chart map.
That makes it easier to judge whether the market is merely tapping a level, actually sweeping it, or accepting away from it with structure and participation.
The script is useful because it tracks the sequence, not just the level.
A prior-day low by itself is only a reference.
A sweep below it is more informative.
A sweep followed by displacement and structure recovery is a different condition again.
Liquidity Cartography is built around those transitions.
The box system is managed over time.
Zones are extended, aged, and deleted when invalidated or expired.
That keeps the chart focused on currently relevant liquidity rather than permanent drawings.
Core Concepts
1. Daily and Weekly Reference Liquidity
The script tracks PDH, PDL, PWH, and PWL.
These are the major reference pools used to judge whether price is probing obvious liquidity.
= request.security(syminfo.tickerid, "D", [high , low ], lookahead = barmerge.lookahead_on)
= request.security(syminfo.tickerid, "W", [high , low ], lookahead = barmerge.lookahead_on)
2. Equal-High and Equal-Low Tracking
Confirmed pivots are compared in ATR terms to identify clustered highs and lows.
3. Sweep-State Persistence
Sweeps remain active for a configurable confirmation window.
That allows follow-through logic to validate the narrative.
4. Displacement Validation
The script checks whether the reaction away from a pool is meaningful through body expansion and gap behavior.
5. Imbalance Management
Imbalance zones are stored and extended as long as they remain active.
6. Repricing Block Management
Order-block style repricing areas are created after structural breaks and managed over time.
7. Filter Stack
Trend, RVOL, RSI, and session filters can refine signal quality.
8. Confluence Scoring
The indicator counts alignment across the active liquidity narrative.
Features
Prior-day and prior-week levels: major reference pools are tracked
Equilibrium levels: daily and weekly range centers are shown
Equal-high / equal-low detection: clustered pools are identified
Sweep persistence: active sweep context remains available for confirmation
Displacement checks: strong rejection is separated from weak noise
Imbalance boxes: active FVG-style zones extend until mitigation or expiry
Repricing blocks: revisit zones are stored and managed
Filter stack: trend, RVOL, RSI, and session alignment are available
Confluence scoring: current liquidity alignment is summarized
Dashboard: active pool, trend, confluence, and signal state are displayed
Input Parameters
Reference Levels:
Show Prior Day Levels
Show Prior Week Levels
Show Equilibrium
Track Weekly Sweeps
Sweep / Zone Logic:
Structure Length
Sweep Reset Bars
Zone Extension
Equal Pool Tolerance ATR
Zone Max Age
History Limits
Validation:
Require Displacement
Displacement Multiplier
Use Trend Filter
Use RVOL Filter
Use RSI Filter
Use Session Filter
How to Use This Indicator
Step 1: Identify the active daily or weekly liquidity pool.
Step 2: Check whether price only touched the pool or actually swept it.
Step 3: Look for displacement and structure response after the sweep.
Step 4: Watch active imbalances and repricing blocks for later revisits.
Step 5: Use the confluence count to separate weak narratives from stronger ones.
Indicator Limitations
Obvious liquidity pools can be tapped or swept multiple times before direction resolves
Object-heavy overlays may appear dense on low timeframes if many zones remain active
Pivot-based pool detection confirms after the swing completes, which is intentional non-repainting behavior
Zones are analytical references, not guarantees of reversal or continuation
Originality Statement
This script is original in how it combines sweep persistence, equal-pool detection, imbalance inventory, repricing blocks, and confluence scoring into one coordinated liquidity framework.
The components are integrated because they all describe the same process:
price probing liquidity, taking it, and either failing or accepting beyond it.
Disclaimer
This indicator is provided for educational and informational purposes only.
It is not financial advice.
Liquidity reactions can fail.
Sweeps can repeat.
No level or zone guarantees a directional outcome.
Always use independent judgment and risk management.
Best Use Cases
Mapping where obvious daily and weekly liquidity is likely resting
Studying how price behaves after a confirmed sweep
Tracking whether displacement and imbalance support the sweep narrative
Marking revisit zones after structural repricing
Interpretation Notes
A sweep by itself is only the beginning of the story.
The more useful sequence is sweep, displacement, structural response, and active zone support.
Equal-high and equal-low references are helpful because they often identify where liquidity may accumulate before the sweep occurs.
The confluence score should be interpreted as a narrative-strength read, not a promise of reversal.
Publication Notes
This script is intended to be published with a clean chart that clearly shows the active liquidity pool, the current sweep state, and one or two relevant active zones.
Do not overload the publication chart with unrelated drawings.
The value of the visual example should come from clarity rather than chart decoration.
-Made with passion by jackofalltrades
Chart Reading Framework
1. Start with the active daily or weekly pool.
2. Determine whether price only touched or truly swept the pool.
3. Check displacement, break state, and confluence.
4. Review active imbalances and repricing blocks for the next revisit path.
5. Use the dashboard to verify whether the liquidity narrative is strengthening or fading.
Why This Matters
Liquidity logic becomes much more useful when it is organized as a process instead of a list of disconnected levels.
This indicator is meant to help the user see that process clearly.
Open-Source Notes
This script is published open source so users can inspect how sweep persistence, imbalance management, and zone aging are handled.
Who This Is For
This indicator is for traders who want a structured liquidity map rather than isolated levels.
It is especially useful for users who think in terms of sweeps, repricing, and revisit zones.
Summary
JOAT Liquidity Cartography turns scattered liquidity references into one organized live framework.
Its main value is clarity.
Additional Notes
The strongest use of this script comes from following the sequence of events rather than reacting to a single box or line in isolation.
Clean publication images should make that sequence obvious.
指標

Liquidity Pools Pro [WillyAlgoTrader]💧 Liquidity Pools Pro is a fully free overlay indicator that automatically detects liquidity zones (equal highs and equal lows), scores them on a 4-factor strength model, catches sweeps (liquidity grabs) with reversal confirmation, and instantly delivers a complete trade plan: entry, stop-loss, three take-profits, and automatic break-even on TP1.
It unifies into a single coherent engine what traders usually have to assemble from 5–7 separate scripts: an adaptive pivot detector, a 4-factor pool scoring system (touches + recency + volume + HTF), sweep detection with close-back confirmation, an ATR-based risk calculator, risk presets, and an informative dashboard.
Works on any instrument (BTC, EURUSD, stocks, indices, futures) and any timeframe without retuning — every threshold is scaled through ATR.
🧩 WHY THESE COMPONENTS WORK TOGETHER
A simple pivot detector just plots dots. A simple sweep signal fires on every wick. A plain ATR stop-loss ignores context. Individually these are noise. Combined, they form a complete mechanism for identifying zones where smart money harvests liquidity, and trading the reversal from them.
Integration chain:
Adaptive Pivot Detection → ATR-based Equality Tolerance → Pool Matching & Clustering → 4-Factor Strength Scoring → HTF Confluence Boost → Sweep Detection (wick + close-back) → Risk Engine (SL/TP/BE) → Position Lock + State Machine → Dashboard + Alerts
— The pivot detector adapts to volatility: length grows when ATR is high (less noise on crypto) and shrinks when ATR is low (faster reaction on forex).
— Tolerance in ATR units lets the engine treat highs/lows as "equal" on any instrument — no manual tick configuration.
— Matching clusters pivots into pools (multiple touches at one zone = thicker liquidity).
— Scoring filters out weak pools and highlights exactly the ones price returns to for stop-runs.
— HTF Confluence adds +20 to strength when a pivot on the higher timeframe aligns — a filter against lower-timeframe traps.
— Sweep is identified as a wick beyond the level + close back inside (classic failed breakout / liquidity grab).
— The risk engine builds a complete trade plan for each signal and trails the stop to break-even after TP1.
— Position Lock prevents opposite signals from silently overwriting the SL/TP of an open position.
Remove any one link and the chain breaks. Sweeps without scoring = noise. Scoring without sweeps = pretty boxes that never trigger. Risk engine without position lock = silent overwrite of an open trade. This pipeline solves all three problems.
🔍 WHAT MAKES IT ORIGINAL
1️⃣ Adaptive Pivot Length — pivot length that adjusts itself to the market.
Most indicators use a fixed pivot length (5, 10, 20). That works on one timeframe of one instrument — and breaks on anything else.
Here the length is computed dynamically:
— volRatio = ATR(14) / ATR(50)
— adaptiveLen = round( clamp( 10 / max(0.5, volRatio), 4, 16 ) )
In high-volatility regimes (volRatio > 1) length shrinks to 4–6 bars — the indicator reacts faster. In low-volatility regimes (volRatio < 1) length grows to 14–16 bars — small noise is filtered out. Can be disabled and set manually (default 8 when Adaptive is OFF).
2️⃣ ATR Equality Tolerance — scale-invariant definition of "equal" levels.
Two pivots are treated as touches of the same liquidity zone if the distance between them ≤ ATR × tolerance (default 0.25).
— 0.15 = strict (tight pools, fewer matches)
— 0.25 = balanced (recommended)
— 0.50 = loose (wider pools, more matches)
This solves a fundamental problem: on BTCUSD, "equal within $50" is normal; on EURUSD the same value is huge. ATR-based tolerance gives one setting that works across all instruments.
3️⃣ 4-factor Strength Score — pool weight on a 0–100 scale.
Every pool is scored as the sum of four components, clamped to 0–100:
— 🎯 Touches (up to 35 points) : (touchCount − 1) × 9, capped at 35. One pivot = 0, two = 9, three = 18, four = 27, five+ = 35.
— ⏳ Recency (up to 35 points) : 35 × 0.5^(ageBars / halfLife). Fresh pool = 35, after one half-life = 17.5, after two = 8.75. Default halfLife = 150 bars.
— 📊 Volume (up to 20 points) : log(max(1, cumVol / median)) × 8, capped at 20. Accumulated on every bar that touches the zone — not just the pivot bar.
— 🔭 HTF Confluence (+20 bonus) : if a higher-timeframe pivot exists within tolerance × 1.5 — +20 added to the total.
Examples:
— Fresh 1-touch pool, no volume, no HTF: 0 + 35 + 0 + 0 = 35
— Fresh 2-touch pool: 9 + 35 + 0 + 0 = 44
— Fresh 3-touch pool with 2× median volume: 18 + 35 + 5.5 + 0 = 58.5
— Old (1 half-life) 2-touch pool: 9 + 17.5 + 0 + 0 = 26.5
4️⃣ Sweep Detection with close-back confirmation — real liquidity grabs, not false wicks.
Pool state transitions follow strict logic:
— STATE_ACTIVE → STATE_SWEPT: wick pierced the level but bar closed beyond it (this is a breakout, not a reversal)
— STATE_ACTIVE → STATE_MITIGATED: wick pierced AND bar closed back inside (real liquidity sweep)
The default signal (Require Body Reversal = ON) only fires on MITIGATED. This is classic SMC "fakeout → reversal" logic. Disable it and any wick sweep will fire (more aggressive, more noise).
5️⃣ Volume-at-Level Accumulation — real volume at the level, not just at the pivot.
Most indicators count volume only on the pivot bar. That's misleading — true liquidity accumulates across all the touches.
Here, on every confirmed bar the engine checks for a zone touch (high or low inside levelBot–levelTop), and if found, adds the bar's volume to the pool's cumVol. Across 40 active pools this is O(P) per bar — fast.
6️⃣ HTF Confluence Engine — higher-timeframe pivots as a filter.
When enabled, pivots from the configured HTF (default 4H) are requested via request.security with lookahead_on on a closed bar (no repaint). If a pool aligns with an HTF pivot within tolerance × 1.5 — +20 is added to its score.
Used to filter signals: HTF-confluent pools cross the strength threshold faster.
7️⃣ 5 Risk Presets + Custom — ready-made SL/TP per trading style.
— Conservative: SL 2.5×ATR, TP 1R/2R/4R
— Balanced: SL 1.5×ATR, TP 1R/2R/3R (default)
— Aggressive: SL 1.0×ATR, TP 1.5R/2.5R/4R
— Scalping: SL 0.8×ATR, TP 0.8R/1.5R/2R
— Custom: manual multipliers
Calculation:
— slDistance = ATR(14) × slMult
— entry = close on the signal bar
— SL = entry ∓ slDistance
— TP1/2/3 = entry ± slDistance × tpMult
8️⃣ Automatic Break-Even after TP1 — stop trails to entry on its own.
After TP1 is touched (and SL didn't fire on the same bar), the active SL is moved to entry. From that point on, any pullback to entry = break-even exit. TP2/TP3 logic continues to track.
Edge case is handled: if both TP1 and SL fire on the same bar, the stop is evaluated against the ORIGINAL value (effectiveSL captured before the BE update). No "magic" loss-saving.
9️⃣ Position Lock — protection against silent trade overwrites.
While a trade is active (activeDir ≠ 0), new signals are blocked. Exception: if the current bar is closing the position (SL or TP3 hit), it's treated as "closing now" and an opposite signal is allowed through.
Without this protection, a fresh signal would silently overwrite the SL/TP of an open position — critical for both manual trading and webhook-based autotrading.
🔟 Pro-style visuals with adaptive contrast.
— Liquidity zones: colored boxes with transparency tied to strength (transparency = 88 − strength × 0.33)
— Mid-line: dotted line through the center of each zone
— Pool labels: SSL/BSL × touch count volume
— SL: solid red line (dims when BE activates)
— Entry: dotted blue
— TP1/2/3: dashed green (turn cyan + ✓ when hit)
— Themes: Auto/Dark/Light with WCAG AA contrast on every background
1️⃣1️⃣ Full alert suite for autotrading — JSON or plain text.
Every signal and trade event triggers alert() in one of two formats:
— Plain text: "🟢 SWEEP BUY | TICKER | TF | Price: X | Pool: 58/100 | SL: ... | TP1: ... | TP2: ... | TP3: ... | R:R: 1.0"
— JSON for webhooks: {"action":"buy","ticker":...,"tf":...,"price":...,"sl":...,"tp1":...,"tp2":...,"tp3":...,"rr":...,"pool_strength":...}
All alerts use alert.freq_once_per_bar_close (no intra-bar duplicates).
⚙️ HOW IT WORKS — CALCULATION FLOW
Step 1 — Pivot detection: on each bar, ta.pivothigh and ta.pivotlow are evaluated with the dynamic left length (adaptiveLen) and the configured right confirmation.
Step 2 — Matching: each new pivot is compared against all active pools of the same type (high/low). If distance ≤ tolerance AND age ≤ maxLookback, it's added as a new touch (level is recalculated as a weighted average).
Step 3 — Pool creation: if no match is found, a new pool is created with touchCount = 1 and the current volume. The HTF bonus is applied if confluent.
Step 4 — Volume accumulation: on each confirmed bar, if high or low touches an active zone, the bar's volume is added to that pool's cumVol.
Step 5 — Strength compute: on demand (lazy), the final strength is calculated using the 4-factor formula.
Step 6 — Sweep check: for every active pool, wickSweep (wick beyond the level) and closeBack (close back inside) are evaluated. State becomes MITIGATED if both true; SWEPT if only wickSweep.
Step 7 — Signal generation: if pool strength ≥ minStrengthSignal AND mitigation is confirmed (or Body Reversal is OFF) AND signals are enabled — a BUY/SELL fires.
Step 8 — Risk setup: on a confirmed signal, entry/SL/TP1/TP2/TP3 are constructed, position lock is engaged, and lines + labels are drawn.
Step 9 — Trade tracking: every bar, SL/TP1/TP2/TP3 hits are evaluated with same-bar-misfire protection (justOpened flag).
Step 10 — Break-even: on TP1 first touch (without simultaneous SL hit), SL is moved to entry, the original SL line dims, and the ENTRY label gets a "→ SL (BE)" suffix.
Step 11 — Auto-reset: on SL hit or TP3 hit, all trade-state variables reset, lines are deleted, position = FLAT.
Step 12 — Pruning: when active pools > maxActivePools (default 40), the oldest swept pool is removed first, then the weakest active pool.
📖 HOW TO USE — STEP-BY-STEP FOR NEWCOMERS
🎯 Quick start (5 minutes):
1. Add the indicator to any instrument and any timeframe.
2. Wait 50–100 bars for the warmup period — the indicator needs to accumulate ATR and pivot history.
3. Keep the dashboard ON (default position: Top Right) — it shows how many pools are tracked.
4. Pick a Risk Preset for your style: Scalping for M1–M5, Balanced for M15–H1, Conservative for H4–D1.
5. Create an alert: right-click on the chart → Add alert → Condition: Liquidity Pools Pro → Any alert() function call → Frequency: Once per bar close.
👁️ Reading the chart:
— 🔴 Red box = Sell-Side Liquidity (SSL) = equal highs where long stops sit. Price tends to wick into them to harvest stops.
— 🟢 Green box = Buy-Side Liquidity (BSL) = equal lows where short stops sit.
— 🔢 Number in brackets = pool strength, 0–100. Higher = thicker liquidity.
— ✖ ×3, ×4 = number of touches at this zone. More touches = more reliable.
— 📊 2.5M, 850K = cumulative volume traded at the level.
— ⚪ Dimmed gray box = swept or mitigated pool (already triggered).
— 🟢 "Long" below the bar = buy signal (BSL sweep + reversal).
— 🔴 "Short" above the bar = sell signal (SSL sweep + reversal).
— 🔵 Blue dotted line = ENTRY.
— 🔴 Red solid line = SL (stop-loss).
— 🟢 Green dashed lines = TP1/TP2/TP3. Cyan with ✓ = already hit.
— 🟠 Amber ENTRY label with "→ SL (BE)" = stop has been moved to break-even.
📊 Dashboard fields:
— Symbol / TF: current instrument and timeframe.
— Pivot Len: pivot length (with "(adapt)" tag when Adaptive is ON).
— Active Pools: total active pools and side breakdown (↑ highs, ↓ lows).
— Strong SSL ↑ / Strong BSL ↓: price and strength of the strongest pool on each side.
— Nearest Above / Below: pools closest to current price.
— Stats: Mit:N Sig:M/T — number of mitigations, signals, total pools. If Sig = 0 — lower the sensitivity (see Tuning).
— Position: current trade state (LONG/SHORT/FLAT).
— SL / TP1 / TP2 / TP3: levels of the active trade. ✓ = hit. "BE @" = stop at break-even.
— Plan R:R: TP1 multiplier (1.0R, 1.5R, 2.0R, etc.).
— Risk %: percent risk from entry to SL.
🔧 Tuning guide — when something feels off:
— Too few signals (Stats Sig: 0/N): lower Min Pool Strength for Signal from 25 to 15. Or disable Require Body Reversal — pure wick sweeps will fire.
— Too many signals, lots of noise: raise Min Pool Strength to 40 (only 2-touch pools) or 60 (only strong multi-touch with volume). Enable HTF Confluence.
— Too many zones, chart is crowded: raise Min Strength to Display to 30–40 — weak pools will be hidden but still tracked internally.
— Zones too narrow, false equality: increase Equality Tolerance from 0.25 to 0.40.
— Zones too wide, catching everything: decrease Equality Tolerance to 0.15.
— Stops getting hit too often: switch from Balanced to Conservative (SL 2.5×ATR instead of 1.5×ATR).
— Signals appear but no position opens: a trade is already active (Position Lock). Check the Position row in the dashboard.
— Strange scoring on forex: disable Volume-Weighted Strength (forex often lacks reliable volume data).
💡 TRADING IDEAS
— Manual trading on signals: only take trades where pool strength ≥ 50 and HTF Confluence is enabled.
— Zones only, no signals: disable Enable Sweep Signals and use the indicator as a pure liquidity map for manual setups.
— Scalping setup: preset Scalping + M1–M5 + Min Strength 15 + Adaptive Pivot ON.
— Swing setup: preset Conservative + H4–D1 + Min Strength 50 + HTF Confluence ON (Daily HTF).
— Webhook autotrading: enable Webhook JSON Format + alert.freq_once_per_bar_close + connect a bot to the JSON payload.
— Confluence with other indicators: combine signals with a trend filter (EMA50, SuperTrend) — only longs above EMA50, only shorts below.
⚙️ KEY SETTINGS
🎯 Liquidity Detection:
— Adaptive Pivot Length (default ON): auto-adjust pivot length to volatility.
— Manual Pivot Length (8): used when Adaptive is OFF.
— Right Confirmation Bars (2): bars to the right needed to confirm a pivot.
— Equality Tolerance ×ATR (0.25): level equality threshold.
— Max Pivot Lookback (200): how far back to search for matches.
— Max Active Pools (40): hard cap on simultaneously tracked pools.
💪 Strength Scoring:
— Min Strength to Display (0): pools below this score are hidden (visual only).
— Strength Half-Life (150): bars after which the recency factor halves.
— Volume-Weighted Strength (ON): include the volume factor in scoring.
📡 Sweep Signals:
— Enable Sweep Signals (ON): generate BUY/SELL signals.
— Min Pool Strength for Signal (25): minimum pool strength to fire.
— Require Body Reversal (ON): require close-back inside the level (recommended).
🔭 HTF Confluence:
— Enable HTF Confluence (default OFF): use higher-timeframe pivots as a filter.
— Higher Timeframe (240 = 4H): which HTF to query.
🛡️ Risk Management:
— Risk Preset (Balanced): Conservative / Balanced / Aggressive / Scalping / Custom.
— ATR Length (Risk) (14): ATR period for SL distance.
— Custom SL/TP1/TP2/TP3 ×ATR / ×Risk : manual multipliers.
— Show SL/TP Lines & Labels (ON): draw trade levels on the chart.
— Break-Even After TP1 (ON): auto-trail stop to entry.
— Show % Distance on Labels (ON): append % from entry to SL/TP labels.
🎨 Visual:
— Theme (Auto): Auto / Dark / Light with adaptive contrast.
— Show Liquidity Zones / Strength Bar / Labels / Volume / Swept Zones / Buy-Sell Markers / Watermark : visual toggles.
— Label Font Size / Signal Marker Size : Tiny → Huge.
📊 Dashboard:
— Show Dashboard (ON), Position (Top Right): corner placement.
🔔 Alerts:
— Webhook JSON Format (OFF): JSON or plain text.
— Alert on SL Hit (ON), Alert on TP Hits & BE (OFF): alert toggles.
🎨 Colors:
— Bullish (Demand) Color / Bearish (Supply) Color : zone colors.
🔔 ALERTS
— 🟢 SWEEP BUY — BSL sweep + reversal, payload: ticker, tf, price, sl, tp1, tp2, tp3, rr, pool_strength
— 🔴 SWEEP SELL — SSL sweep + reversal, same payload structure
— 🛑 SL HIT — stop-loss triggered (or 🛡️ BE STOP-OUT when Break-Even is active)
— 🎯 TP1 HIT / 🎯 TP2 HIT / 🏆 TP3 HIT — take-profit hits (only fired when SL didn't trigger on the same bar)
— 🛡️ BREAK-EVEN — stop moved to entry
All alerts support both plain text and JSON webhook formats. All fire on alert.freq_once_per_bar_close — no intra-bar duplicates and no repaint.
⚠️ IMPORTANT NOTES
— 🚫 No repainting. Signals are generated only on barstate.isconfirmed (closed bar). Pivots are confirmed with a right window of rightConfirmInput bars (default 2) — meaning the actual swing point is in the past by N bars, but the indicator does not redraw already-drawn pools. HTF data via request.security uses lookahead_on on the offset bar — a standard non-repainting technique.
— 📐 Warmup period: the first 50+ bars (max(50, atrLenRisk + 10)) the indicator does not generate signals — it accumulates ATR and pivot history.
— ⚖️ Position Lock is not absolute against opposite signals: if the active trade closes on the current bar (SL or TP3 hit), an opposite signal will pass. This is by design — instant two-way blocking is impossible.
— 📊 Volume factor is optional: on forex instruments without reliable volume, disable Volume-Weighted Strength.
— 🛠️ This is an analysis tool, not a trading bot. The indicator detects liquidity zones, scores them, identifies sweeps, and proposes a trade plan — but the decision to open a position is yours. Past performance does not guarantee future results. Test on demo before trading live.
— 🌐 Universal compatibility: works on any instrument (crypto, forex, stocks, indices, futures) and any timeframe (M1 → M).
Version v1.1.5. Fully free. Open-source. 指標

指標

Fractal Liquidity Map [JOAT]Fractal Liquidity Map
Introduction
The Fractal Liquidity Map renders the complete institutional liquidity landscape through six non-overlapping visual systems that each occupy their own visual lane: Williams Fractal markers, cluster support/resistance zones, equal highs/lows liquidity pool lines, sweep detection signals, multi-length pivot levels, and a Hann FIR trend ribbon. Every element is designed to coexist without visual clutter — cluster zones are thin dual-line bands, liquidity pools are dashed lines, sweeps are plotshape arrows that require no screen space accumulation.
The core problem this solves: most liquidity tools accumulate dozens of overlapping boxes that become unreadable over time. This indicator uses a clean-redraw architecture for zones — all drawing objects are deleted and recreated on each bar using only current price-level arrays, preventing any stacking, overlap, or ghost boxes from persisting.
Core Concepts
1. Williams Fractal Detection
A fractal high is a bar whose high is the highest in a configurable N-bar window on both sides; a fractal low is the lowest in the same window. Fractals are confirmed on bar close — the center bar's status is only registered after the right-side confirmation bars have closed:
bool frac_hi = high == ta.highest(high, i_frac_len * 2 + 1)
bool frac_lo = low == ta.lowest (low, i_frac_len * 2 + 1)
Fractal marks are rendered as small diamond shapes above and below the relevant bars, providing the foundational structural pivot map from which all other elements derive.
2. Cluster S/R Zones
When N or more fractals converge within a price band of 1x ATR, they are classified as a cluster zone — an area where price has pivoted multiple times, indicating persistent institutional interest. These are rendered as thin dual-line bands (solid top edge + dotted bottom edge) rather than filled boxes:
// Clean-redraw architecture: all lines deleted and recreated on barstate.islast
if barstate.islast
for each level in clust_res_lvls
line.new(start_bar, level, bar_index + 10, level,
color = i_res_col, style = line.style_solid, width = 2)
line.new(start_bar, level - atr_14 * 0.3, bar_index + 10, level - atr_14 * 0.3,
color = color.new(i_res_col, 60), style = line.style_dotted)
Only the price levels are stored between bars (as float arrays). The drawing objects are fully recreated on last bar, guaranteeing zero accumulation or overlap regardless of how many bars the zone has existed.
3. Equal Highs/Lows Liquidity Pools
When two or more swing highs (or lows) within a lookback window fall within a tolerance band of each other (default 0.15x ATR), they form an Equal Highs (EQH) or Equal Lows (EQL) liquidity pool. These levels are targets for stop-hunt sweeps by institutional participants because retail stop orders cluster above EQH and below EQL:
float pool_tol = i_pool_tol * atr_14
bool near_hi = math.abs(_pool_hi - _prev_pool_hi) < pool_tol
bool near_lo = math.abs(_pool_lo - _prev_pool_lo) < pool_tol
Pools render as thin dashed lines with compact EQH/EQL labels. Like cluster zones, they use the clean-redraw architecture — no boxes, no accumulation, no stacking.
4. Sweep Detection
A sweep occurs when price breaks through a known liquidity pool level (above EQH or below EQL) and then closes back inside the prior range — confirming a stop-hunt without follow-through:
bool sweep_hi = high > pool_hi_ref and close < pool_hi_ref
bool sweep_lo = low < pool_lo_ref and close > pool_lo_ref
Sweeps are displayed as plotshape arrows (upward triangle below bar for bullish sweep, downward triangle above bar for bearish sweep). Because plotshape markers occupy zero screen real estate compared to boxes, sweeps cannot overlap or accumulate. An optional single-bar background flash draws attention to sweep bars.
5. Multi-Length Pivot Levels
Three configurable pivot lengths (default: 10, 30, 75 bars) generate independent sets of support and resistance levels. Each set uses its own resolution and color gradient encoding distance from current price — nearby levels are opaque, distant levels are transparent. Deduplication logic prevents levels from multiple pivot lengths from overlapping if they fall within ATR proximity.
6. Hann FIR Trend Ribbon
A three-layer Hann Window FIR filter ribbon provides directional bias in the background. The ribbon is fully described in the Adaptive Spectral Bands indicator. Here it serves as a trend filter — when the ribbon is bullish (fast layer above slow), resistance zones are more likely to hold; when bearish, support zones are the focus. Ribbon crossover events flash the background briefly.
Features
Williams Fractal Marks: Configurable lookback diamond markers at confirmed fractal highs and lows
Cluster S/R Zones: Dual-line thin bands at price areas where multiple fractals converge, with full deduplication
Liquidity Pool Lines: Dashed lines at equal highs/lows with EQH/EQL labels — no boxes, no stacking
Sweep Detection: plotshape arrows at confirmed liquidity sweep bars plus optional background flash
Multi-Length Pivots: Three independent pivot resolutions with distance-opacity gradient
Hann FIR Ribbon: Three-layer trend ribbon with crossover signals and background flash
Zero-Overlap Architecture: Clean-redraw system for all zone elements eliminates accumulated drawing object clutter
Dashboard: Active cluster zones, active pool lines, sweep count, ribbon direction, and ATR value
Alerts: Bullish sweep, bearish sweep, ribbon crossover bullish, ribbon crossover bearish
Input Parameters
Fractal Detection:
Fractal Length: Lookback bars on each side for fractal confirmation (default: 5). Larger = fewer, more significant fractals.
Show Fractal Marks: Toggle diamond marker rendering (default: on)
Cluster Zones:
Min Fractals for Cluster: Minimum fractal count within ATR band to qualify as a cluster (default: 3)
Max Cluster Zones: Maximum simultaneous cluster zones rendered (default: 6)
Show Cluster Zones: Toggle cluster zone rendering (default: on)
Liquidity Pools:
Pool Tolerance (x ATR): Price proximity for equal high/low classification (default: 0.15)
Pool Lookback (bars): Window for equal high/low detection (default: 50)
Max Pool Lines: Maximum pool lines displayed (default: 8)
Show Liquidity Pools: Toggle pool line rendering (default: on)
Sweep Detection:
Show Sweep Signals: Toggle sweep arrows (default: on)
Flash Background on Sweep: Single-bar background highlight on sweep bar (default: on)
Multi-Length Pivots:
Pivot 1 / Length: First pivot resolution (default: enabled, 10 bars)
Pivot 2 / Length: Second pivot resolution (default: enabled, 30 bars)
Pivot 3 / Length: Third pivot resolution (default: enabled, 75 bars)
Trend Ribbon:
Show Hann Ribbon: Toggle ribbon visibility (default: on)
Ribbon Length: Base FIR filter length (default: 20)
Ribbon Spacing: Gap between ribbon layers (default: 8)
Colors:
Resistance / Support / Pool / Sweep: Independent color selection for each element type
How to Use This Indicator
Step 1: Build the Liquidity Map
Zoom out to a 1-4 hour timeframe and let the cluster zones and pool lines populate. These are your primary reference levels. The cluster zones (multiple fractal convergences) are the highest-confidence levels. Pool lines (equal highs/lows) are the stop-hunt targets.
Step 2: Watch for Sweeps
A sweep arrow above a pool line indicates a stop-hunt of sellers above EQH. A bullish sweep (price broke above EQH but closed back inside) is frequently a reversal signal — institutions cleared the sell-side liquidity and may now push price higher. The background flash marks exactly which bar this occurred on.
Step 3: Use the Ribbon for Direction
Trade cluster zone bounces only in the direction of the Hann ribbon. If the ribbon is bullish (green), focus on support cluster zones for long entries. Resistance zones in a bullish ribbon context are areas to manage position, not reverse.
Step 4: Stack with Multi-Pivot Levels
Where a multi-length pivot level aligns with a cluster zone, the confluence is significant. A 75-bar pivot and a cluster zone at the same price level is a major institutional reference that warrants tighter risk and larger position sizing consideration.
Originality Statement
This indicator is original in its integration of fractals, volume-derived cluster zones, equal highs/lows pools, sweep detection, and Hann FIR ribbon into a single zero-overlap visual system. Its publication is justified because:
The clean-redraw architecture (storing only price levels in arrays, recreating all drawing objects on last bar) is a fundamental departure from the standard approach of accumulating box arrays — it solves the overlap and clutter problem at the architectural level, not with cosmetic band-aids
Cluster zones derived from fractal convergence within ATR tolerance provide an objective, quantitative method for identifying price areas with multiple structural pivots — avoiding the subjectivity of manual zone drawing
Sweep detection using pool levels as reference (not arbitrary lookback highs/lows) creates a directional signal directly tied to the liquidity context in which the sweep occurred
All six visual layers are designed for simultaneous display without interference — fractal marks at bar tops/bottoms, cluster zones as thin lines, pool lines as dashed lines, sweeps as arrows, ribbon below price, pivots as semi-transparent overlays
Limitations
The clean-redraw system recreates all line objects on every bar close (barstate.islast). On charts with very long history, this processes large arrays. Performance degrades gracefully but is slower than static object creation.
Fractal confirmation requires N bars on each side, meaning fractals always lag behind current price by the fractal length. Fresh structural pivots will not appear until confirmed.
Equal highs/lows detection uses ATR-relative tolerance. On instruments with irregular volatility (news events, halts), temporary ATR spikes may cause pools to merge or split unexpectedly.
Ribbon direction is a trend approximation, not a prediction. Sweep signals against the ribbon trend should be weighted less than those in the ribbon direction.
Disclaimer
This indicator is provided for educational and informational purposes only. It does not constitute financial advice or a recommendation to buy or sell any instrument. All trading involves risk of loss. Liquidity zones and sweep signals do not guarantee price direction. Always use proper risk management.
-Made with passion by jackofalltrades
指標

Prime Volume Profile + Liquidity HeatmapThis indicator is designed to provide a clear, institutional-style view of market structure and liquidity distribution, combining a fully customizable Volume Profile with a dynamic Liquidity Heatmap.
It operates on a daily basis, automatically resetting at the start of each new trading day to ensure that all calculations reflect fresh, relevant market data.
🔍 Core Features
• Customizable Volume Profile (Daily)
The indicator builds a high-resolution Volume Profile for the current trading day, allowing traders to visualize where trading activity has been most concentrated.
It highlights three key levels:
POC (Point of Control) – the price level with the highest traded volume during the day. This represents the area where the market has found the strongest agreement between buyers and sellers.
VAH (Value Area High) – the upper boundary of the value area, where approximately 70% of the day’s total volume has been traded.
VAL (Value Area Low) – the lower boundary of the value area, completing the range in which most trading activity has occurred.
These levels are recalculated in real time and reset daily, making them highly relevant for intraday and scalping strategies.
• Liquidity Heatmap
In addition to the volume profile, the indicator provides a visual heatmap of recent liquidity.
Areas with higher intensity represent zones where a significant amount of volume has been transacted.
More transparent zones indicate low participation or “empty” areas in the market.
This allows traders to quickly identify:
Where liquidity is concentrated
Where price is more likely to react
Where inefficiencies or low-interest zones exist
🧠 Understanding Liquidity
In trading, liquidity refers to the amount of buy and sell orders available at specific price levels.
High liquidity zones:
Attract price like a magnet
Often act as support/resistance
Are commonly revisited by the market
Low liquidity zones:
Allow price to move quickly
Often result in sharp, impulsive moves
Understanding liquidity helps traders interpret why price moves, not just where it moves.
⚙️ How to Use This Indicator
This tool is best used as a confirmation layer within a broader trading strategy.
Common use cases:
POC as a magnet
Price often gravitates toward the Point of Control. Traders monitor reactions around this level for mean reversion or continuation setups.
VAH / VAL as reaction zones
These levels can act as dynamic support and resistance.
Breakouts or rejections around these zones can signal potential trade opportunities.
Heatmap for execution timing
Use the liquidity heatmap to identify:
High-interest zones for entries or exits
Low-liquidity areas where price may move quickly
⚠️ Important Disclaimer
This indicator is not financial advice and does not provide direct buy or sell signals.
It is intended to be used as a decision-support tool, ideally in combination with:
Price action analysis
Market structure
Other indicators or trading strategies
🎯 Summary
This indicator gives you a real-time map of market participation, helping you understand:
Where volume is concentrated
Where liquidity is sitting
Where price is likely to react
Used correctly, it provides a significant informational edge, especially for intraday and short-term traders. 指標

Liquidity Thermal Map [JOAT]Liquidity Thermal Map
Introduction
The Liquidity Thermal Map is an overlay indicator that identifies and visualizes liquidity pockets — price zones where trapped participants are likely clustered — and ranks their significance using a heat-mapped color scale driven by volume and price range data. Rather than treating all swing highs and lows equally, it weights each zone by the liquidity activity present at that pivot bar, then applies power-law contrast stretching so that the most significant zones immediately stand out from background noise.
The goal is not to predict where price will go. The goal is to surface which untested zones carry the most liquidity weight, so a trader can make their own informed decisions about potential targets or areas of interest.
---
Core Concepts
1. Pivot Detection
Zones are seeded at confirmed swing pivots using Pine Script's built-in pivot functions:
pivH = ta.pivothigh(high, leftPiv, rightPiv)
pivL = ta.pivotlow(low, leftPiv, rightPiv)
A pivot high marks a bar where bears may have been trapped above — price reached that level, reversed, and left unfilled orders behind. A pivot low marks the mirror situation for trapped bulls. The left bars and right bars inputs control how many confirming bars are required on each side, balancing sensitivity against noise.
2. Liquidity Metric and Heat Normalization
Each pivot is scored using one of three selectable metrics:
Vol x Range (default): volume * (high - low) * 100 — rewards bars with both high volume and wide price movement
Volume only: raw volume at the pivot bar
Range only: the high-low spread at the pivot bar
Raw scores are normalized across all active pockets using a rolling min-max calculation:
norm = (metric - min) / (max - min)
heat = math.pow(norm, heatContrast)
The power-law contrast stretch (controlled by the Heat Contrast input) compresses lower-significance pockets toward zero and expands higher-significance ones toward one. A contrast value below 1.0 spreads pockets more evenly; above 1.0, only the highest-scoring pockets register strong color.
3. Zone Construction
Each pocket is drawn as a box:
Short liquidity pocket (at a pivot HIGH, bears trapped above): top = pivotHigh + ATR * bandWidth, bottom = pivotHigh
Long liquidity pocket (at a pivot LOW, bulls trapped below): top = pivotLow, bottom = pivotLow - ATR * bandWidth
ATR scaling ensures band width adapts to current volatility rather than using a fixed pip or point value. Short pockets color from yellow (low heat) through deeper yellows. Long pockets color from a faded cyan through solid cyan-blue. Both gradients are computed with color.from_gradient(heat, 0, 1, faded_base, solid_base) , making the heat ranking immediately readable at a glance.
4. Three-State Lifecycle
Every pocket passes through a defined state machine:
Active: The zone is untested. The box extends rightward each bar by the Extend Bars amount, keeping it visible on the current chart.
Hit (Frozen): Triggered when price sweeps through the midpoint of the zone (high >= midpoint AND low <= midpoint on the same bar). The box stops extending, color fades, and the label is removed — signaling that the pocket has been swept and liquidity likely absorbed.
Expired: When a pocket's age exceeds the Lookback setting without being hit, it is removed entirely and all associated arrays are cleaned up.
This lifecycle gives real-time feedback: solid, bright zones are intact and untested; faded zones have been swept; only the most recent, significant pockets within your lookback window are visible.
5. Scale Legend
A 24-cell gradient table is drawn on-chart running from the short liquidity color to the long liquidity color, providing a continuous reference for the heat scale being applied to all visible pockets.
---
Features
Pivot-anchored liquidity zones for both long and short trapped-participant scenarios
Three selectable liquidity metrics: Vol x Range, Volume only, Range only
Power-law contrast stretching for visual prioritization of high-significance zones
ATR-scaled zone width that adapts to current market volatility
Three-state lifecycle (Active → Hit → Expired) per pocket with visual state changes
Dual-color gradient system — cyan-blue for long pockets, yellow for short pockets
On-chart 24-cell heat scale legend
Configurable max pocket count to manage chart performance
Visual toggles for boxes, labels, and the legend table
---
Input Parameters
Pivot Left Bars (default 10): Bars required to the left of a pivot for confirmation. Higher values = fewer, more significant pivots.
Pivot Right Bars (default 5): Bars required to the right of a pivot for confirmation. Increasing this delays detection but improves pivot quality.
Lookback / Max Age (default 200): Maximum bar age before a pocket expires and is removed.
Max Pockets (default 50): Upper limit on simultaneous active pockets. Reducing this improves performance on lower-end charts.
ATR Length (default 14): Period for the ATR calculation used in band width scaling.
ATR Band Width (default 0.5): Multiplier applied to ATR to set zone height. Higher values create wider zones.
Extend Bars (default 50): How many bars ahead each active pocket box extends on each update.
Heat Contrast (default 0.5): Power-law exponent for contrast stretching. Values below 1.0 spread pockets more evenly; above 1.0 increases contrast between high and low scoring zones.
Metric Mode: Selects the liquidity scoring metric — Vol x Range, Volume, or Range.
Show Boxes / Show Labels / Show Legend: Individual visibility toggles for each visual component.
---
How to Use
Identifying high-priority zones: Bright, fully saturated boxes represent the highest-scoring untested liquidity pockets within your lookback window. These are the zones where the most volume-weighted trapped participants may be present.
Tracking swept zones: When a box fades, the pocket has been hit — price moved through its midpoint. Faded zones can serve as reference for areas that have already seen liquidity absorption.
Adjusting sensitivity: Increasing the left/right pivot bars reduces the total number of pivots detected, focusing only on more structurally significant swing points. Decreasing them creates a denser map suitable for shorter timeframes.
Interpreting the legend: The 24-cell scale legend in the corner maps the full gradient range, from the lowest-heat short pocket color to the highest-heat long pocket color.
Timeframe considerations: On higher timeframes (4H, Daily), fewer pivots form and each carries more weight. On lower timeframes, tightening the ATR band width and increasing heat contrast helps reduce visual clutter.
---
Limitations
Pivot detection is inherently lagging — a pivot is only confirmed after the right-side bars have closed, meaning the zone is plotted some bars after the pivot actually formed.
The liquidity metric scores a pocket by activity at the pivot bar itself , not the full swing sequence leading to it. A pivot formed on a single high-volume bar will score higher than one formed over a gradual, multi-bar move.
Volume data quality varies by broker and data feed. On instruments with unreliable or synthetic volume (some forex pairs, CFDs), the Vol x Range metric may not reflect true market participation.
The indicator does not account for partial fills or iceberg orders. A zone being "hit" means price swept through the midpoint — it does not confirm full liquidity absorption.
No indicator, including this one, predicts future price movement. A high-heat untested zone is an area of potential interest, not a guaranteed reversal or reaction point.
Performance may degrade on very active charts with high Max Pocket settings. Reduce Max Pockets if chart rendering slows.
The heat scale is relative to the current set of visible pockets. Adding more historical data (longer lookback) changes the normalization range and will recolor all currently visible pockets.
---
Originality Statement
Most liquidity mapping tools mark swing highs and lows with equal visual weight — every pivot gets the same line, box, or label. This indicator departs from that approach in three ways:
First , each pocket is scored by the product of volume and price range at its pivot bar (or volume/range alone as alternatives), producing a liquidity significance score rather than a binary present/absent mark.
Second , power-law contrast stretching is applied to the normalized scores, which means the visual encoding (color saturation) is non-linear. Minor pockets compress toward the faded end of the gradient; truly significant pockets expand toward the saturated end. This is a deliberate perceptual design choice — not simply coloring zones by value, but stretching the gradient to maximize discriminability at the high end.
Third , the three-state lifecycle (Active → Hit → Expired) treats each pocket as a dynamic object that responds to price action in real time. The visual state change on hit provides immediate feedback without requiring the trader to manually track which levels have been tested. The combination of significance scoring, contrast-stretched heat mapping, and lifecycle state management in a single overlay tool is the core contribution of this indicator.
---
Disclaimer
This indicator is provided for informational and educational purposes only. It does not constitute financial advice, investment advice, or a recommendation to buy or sell any asset. Past behavior of price around liquidity zones does not guarantee future behavior. All trading involves risk. You are solely responsible for your own trading decisions.
-Made with passion by officialjackofalltrades
指標

指標

Liquidity Entry ZonesLiquidity Entry Zones
Liquidity Entry Zones is an open-source liquidity-sweep entry framework built around one specific analytical idea:
when price moves through a recently formed liquidity level, then reclaims back through that area with acceptable candle quality and directional context, that event can be treated as a structured entry opportunity rather than as a generic wick sweep or random rejection candle.
This script is not designed to mark every swing high or swing low, and it is not intended to behave like a generic support/resistance overlay, a basic pivot script, or a simple “liquidity sweep detector” that treats every sweep in the same way. Its purpose is to store recent liquidity levels, detect meaningful sweeps through those levels, validate reclaim behavior, filter the candle using quality conditions, confirm the setup inside a limited time window, and optionally project a fixed-risk trade structure on the chart for review. :contentReference {index=1}
The script also includes optional sweep guides, signal visuals, a compact status panel, and an internal trade simulation layer so users can inspect how the framework behaves under the chosen settings. Those review tools are included to support chart study and comparison, not to imply future performance. :contentReference {index=2}
OPEN-SOURCE NOTE
This script is published open-source so users can inspect the logic directly, verify what the script is doing, and adapt parts of the workflow for their own research if they wish.
Even though the code is open, this description is intentionally detailed because many TradingView users do not read Pine Script. The goal is for a user to understand what the script does, how it works, why its parts belong together, and how it may be used in practice without needing to reverse-engineer the code line by line.
OVERVIEW
At a high level, the script does seven things:
1. It stores recent pivot highs and pivot lows as liquidity reference levels.
2. It checks whether price sweeps through one of those stored levels by a minimum pip distance.
3. It requires reclaim behavior after the sweep, using either a close-back-inside rule or a stronger reclaim condition.
4. It filters the sweep candle using wick percentage, body percentage, candle range, optional EMA context, and optional midline confirmation.
5. It allows a limited confirmation window after the sweep so entries are not forced to happen only on the exact sweep bar.
6. It can project a fixed take-profit / stop-loss model and track simulated outcomes.
7. It summarizes the current state and projected results in a status panel.
The script is therefore meant to function as a complete liquidity-sweep reclaim framework rather than as a single-purpose pivot or line-drawing tool. :contentReference {index=3}
CORE IDEA
Many sweep-based tools detect only one event: price traded above a prior high or below a prior low.
This script takes a narrower and more selective approach.
Its central assumption is that a sweep alone is not enough. A useful entry event requires more than just temporary liquidity violation. The script therefore asks additional questions:
- Was the swept level a recent stored liquidity level derived from pivot structure?
- Did price move far enough beyond that level to qualify as a real sweep?
- Did price reclaim back through that area in a meaningful way?
- Was the sweep candle structurally acceptable in terms of wick, body, and range?
- Did the confirmation happen within a defined number of bars?
- Was the signal aligned with the optional EMA context?
- Did the confirmation candle behave the way the selected setup requires?
Because of that, the script does not treat all sweeps equally. It attempts to organize the process into a more selective sequence:
first identify liquidity,
then detect a sweep,
then validate reclaim quality,
then confirm within a limited window,
then project the resulting setup into a standardized chart-review structure.
That narrower focus is the main reason the script exists in its current form. :contentReference {index=4}
WHY THIS SCRIPT IS NOT A SIMPLE MASHUP
This script combines multiple components, but they are not included simply to place more features into one publication.
Each component has a specific role inside the same analytical process:
- Pivot storage defines where recent liquidity levels exist.
- Sweep detection checks whether those levels have actually been taken by price.
- Reclaim logic checks whether price closes back through the swept area in a meaningful way.
- Candle-quality filters reduce weak or low-information sweeps.
- The EMA filter provides optional directional context.
- The confirmation window prevents stale sweeps from remaining valid indefinitely.
- The cooldown logic reduces clustered signals.
- The trade simulation layer maps the resulting setup into a consistent risk framework.
- The panel organizes current state and projected review metrics into one readable output.
These layers are interdependent.
Without the pivot-based liquidity storage, there is no structured level to sweep.
Without the minimum sweep distance, trivial overextensions would count too easily.
Without reclaim validation, the script would mark many sweeps that never actually regained the level.
Without wick/body/range filters, weak candles would be treated too similarly to stronger rejection candles.
Without the confirmation window, old sweep conditions could stay alive for too long.
Without the EMA filter, the framework would lose one of its optional directional context filters.
Without the simulation layer, the user would still need to draw projected entry, stop, and target structure manually.
Without the status panel, the user would have less organized feedback when monitoring current sweep state, bias, and simulated results.
For that reason, the script is intended as a single liquidity-reclaim framework, not as a random bundle of unrelated features. :contentReference {index=5}
WHAT THE SCRIPT DOES
The script stores recent pivot highs and lows as liquidity levels, then watches for price to trade through those levels by at least the selected sweep distance in pip terms.
Once a sweep occurs, the script can evaluate whether the candle reclaimed back through the level. That reclaim can be interpreted in one of two ways:
- Close Back Inside
- Strong Reclaim
After that, the script can apply candle-quality filters based on:
- wick percentage,
- body percentage,
- minimum candle range,
- optional EMA alignment,
- optional midline-break confirmation,
- and candle-body direction for long or short confirmation.
If the setup remains valid within the selected confirmation window, the script can confirm a BUY or SELL signal.
When enabled, the simulation layer can then project:
- entry,
- fixed stop loss,
- fixed take profit,
- entry zone,
- target box,
- stop box,
- entry and invalidation lines,
- and active trade labels.
The script can also show sweep guides, signal markers, bar coloring, and a status panel summarizing its current state and projected statistics. :contentReference {index=6}
HOW THE SCRIPT WORKS
1) LIQUIDITY LEVEL STORAGE
The script uses pivot highs and pivot lows to create recent liquidity reference points.
A pivot high becomes a candidate buy-side liquidity reference.
A pivot low becomes a candidate sell-side liquidity reference.
The script stores a configurable number of recent levels so that sweep detection is based on previously identified structural points rather than arbitrary price movement. This makes the framework level-based rather than purely candle-based. :contentReference {index=7}
2) SWEEP DETECTION
Once liquidity levels are stored, the script checks whether current price moves beyond a recent level by at least the configured minimum sweep distance.
For a bearish sweep setup:
price must move above a stored high.
For a bullish sweep setup:
price must move below a stored low.
This distance is measured in pip terms using the selected pip-size logic. That means the same script can adapt to forex, JPY pairs, gold, or index-style symbols more consistently, assuming the pip mode is set correctly. :contentReference {index=8}
3) RECLAIM RULE
A sweep alone is not enough.
After the level is taken, the script requires reclaim behavior. It supports two reclaim interpretations:
Close Back Inside:
price must close back inside the swept level.
Strong Reclaim:
price must close back inside the swept level and also close beyond the candle midline in the reclaim direction.
This is important because many sweep candles do not actually reclaim decisively. The reclaim rule exists to distinguish “level taken” from “level taken and then actively rejected back through.” :contentReference {index=9}
4) CANDLE QUALITY FILTERS
The script evaluates sweep-candle quality using:
- minimum wick percentage,
- maximum body percentage,
- minimum candle range in pips.
This means the framework prefers sweeps where the wick expresses the actual sweep behavior and the body does not dominate too heavily relative to the total candle. The minimum-range filter helps avoid very small candles that technically sweep a level but do not carry enough information.
The script also allows:
- long confirmation must be bullish,
- short confirmation must be bearish.
These body-direction filters make the confirmation stricter and help align the final signal with the intended reclaim direction. :contentReference {index=10}
5) OPTIONAL EMA CONTEXT
The script includes an optional EMA trend filter using a configurable EMA length.
If enabled:
- long-side confirmations require price above the EMA,
- short-side confirmations require price below the EMA.
This does not turn the script into a full trend-following system. Instead, it acts as a directional context filter designed to reduce signals that reclaim against the selected EMA bias. :contentReference {index=11}
6) CONFIRMATION WINDOW
The script does not require the final entry to happen only on the exact sweep candle.
Instead, when a valid sweep is detected, it can remain eligible for a limited number of bars. During that confirmation window, the script checks whether the final bullish or bearish confirmation conditions are met.
This matters because some traders want the sweep candle itself to reclaim strongly, while others want to allow one or two bars for the actual confirmation to develop. The confirmation window makes that possible without letting very old sweep conditions remain valid indefinitely. :contentReference {index=12}
7) MIDLINE CONFIRMATION
The script also supports an optional requirement that price close beyond the midpoint of the sweep candle.
For bullish confirmation:
price must close above the sweep candle midpoint.
For bearish confirmation:
price must close below the sweep candle midpoint.
This adds an additional reclaim-strength condition and is intended to reduce weaker closes that technically qualify but do not show enough directional reclaim behavior. :contentReference {index=13}
8) SIGNAL COOLDOWN
The script includes a cooldown period between signals.
Once a signal fires, the framework waits the configured number of bars before allowing a new one. This reduces clustered signals and prevents the chart from rapidly stacking similar setups in a short space of time. :contentReference {index=14}
9) QUALITY SCORE
The script computes an internal quality score for the sweep using a weighted combination of:
- wick contribution,
- body contribution,
- candle-range contribution,
- EMA alignment,
- reclaim success,
- and midline-break success.
This score is used as an internal summary of signal quality and also appears in the panel or labels depending on the visual configuration.
The score is not a guarantee of outcome. It is simply an internal ranking model that summarizes how well the current setup meets the script’s own filter conditions. :contentReference {index=15}
10) TRADE SIMULATION
When enabled, the script can simulate a fixed-risk trade projection.
For long signals:
- entry is placed at close,
- TP is placed above entry by the selected take-profit pip distance,
- SL is placed below entry by the selected stop-loss pip distance.
For short signals:
- entry is placed at close,
- TP is placed below entry by the selected take-profit pip distance,
- SL is placed above entry by the selected stop-loss pip distance.
The simulation can also:
- block new signals while a trade is active,
- keep or hide stopped trades,
- draw entry zone, target zone, stop zone, entry line, invalidation line, and projection line,
- track total trades, wins, losses, and net pips.
This is a chart-review tool, not an execution engine. Its purpose is to make the framework easier to inspect after the signal appears. :contentReference {index=16}
11) SAME-BAR PRIORITY
In the version you shared, same-bar TP/SL handling is conservative: if both target and stop appear to be touched on the same bar after entry, SL takes priority. This matters because bar data alone does not reveal exact intrabar order, and a strict rule prevents artificially optimistic results. :contentReference {index=17}
12) PANEL AND STATE MODEL
The status panel summarizes the current internal state of the framework. It can display items such as:
- whether simulation is on,
- current EMA-based bias,
- sweep state,
- signal state,
- quality score,
- volatility state,
- session state,
- risk state,
- total trades,
- win rate,
- net pips,
- max drawdown in pips.
This panel is meant to condense the script’s state into one readable location rather than force the user to infer everything visually from price bars and labels alone. :contentReference {index=18}
WHAT MAKES THIS SCRIPT ORIGINAL
This script uses familiar building blocks such as:
- pivots,
- liquidity sweeps,
- EMA filtering,
- candle wick/body analysis,
- fixed TP/SL simulation,
- status panels.
Those building blocks are not original by themselves.
The originality of this script is not in inventing a completely new primitive indicator. The originality lies in how those familiar elements are arranged into one selective workflow:
pivot-based liquidity storage
→ minimum-distance sweep detection
→ reclaim validation
→ wick/body/range quality filtering
→ optional EMA alignment
→ limited-bar confirmation
→ cooldown control
→ fixed-risk trade projection
→ status-panel review
That full sequence is the main reason this script exists as its own publication.
It is not intended to be simply another pivot script, another stop-hunt detector, another EMA tool, or another TP/SL box script. It is specifically a liquidity-reclaim entry framework that combines structural level storage, sweep validation, candle-quality filtering, confirmation logic, and projected review in one workflow. :contentReference {index=19}
WHAT APPEARS ON THE CHART
Depending on settings, the chart may display:
- EMA filter,
- sweep guides,
- signal markers,
- BUY / SELL labels,
- signal bar coloring,
- entry zone,
- target zone,
- stop zone,
- entry line,
- invalidation line,
- projection path,
- status panel,
- TP / SL hit labels.
Users who want a cleaner chart can disable some visual components and keep only the layers most relevant to their workflow. :contentReference {index=20}
HOW TO USE THE SCRIPT
A practical workflow is:
1. Add the script to a standard candlestick chart.
2. Choose the correct pip mode for the instrument you are analyzing.
3. Set the pivot length and stored-level count to define how the script builds liquidity references.
4. Set the minimum sweep distance so trivial level violations are filtered out.
5. Choose the reclaim rule you want to use.
6. Configure candle-quality filters such as wick %, body %, and minimum range.
7. Decide whether to use the EMA trend filter.
8. Decide whether to require midline confirmation.
9. Choose the confirmation window and cooldown length.
10. If simulation is enabled, set TP and SL distances and decide whether new signals should be blocked while a trade is active.
11. Wait for a confirmed bullish or bearish liquidity reclaim.
12. Use the projected trade structure and panel as an analysis framework rather than as a blind instruction.
13. Review how the same rules behave over time and across symbols before relying on the framework in a live decision process. :contentReference {index=21}
This script is best understood as a structured decision-support and chart-review tool, not as a fully self-sufficient trading system.
SETTINGS REFERENCE
Trend Filter
- EMA Length: sets the EMA used for optional directional context.
- Use EMA Trend Filter: enables or disables EMA filtering.
Pip Settings
- Pip Mode: controls how pip size is interpreted for the current instrument.
Liquidity Sweep Detection
- Swing Pivot Length: defines the pivot depth used to create liquidity levels.
- Stored Liquidity Levels: controls how many recent levels remain in memory.
- Minimum Sweep Distance (Pips): defines how far price must move beyond a level to count as a sweep.
- Reclaim Rule: selects whether reclaim is based on close back inside or a stronger reclaim condition.
Candle Quality Filters
- Minimum Sweep Wick %: minimum wick contribution required from the sweep candle.
- Maximum Body %: maximum body share allowed for the sweep candle.
- Minimum Candle Range (Pips): minimum size required for the sweep candle.
- Long Confirmation Must Be Bullish: requires bullish body for long confirmations.
- Short Confirmation Must Be Bearish: requires bearish body for short confirmations.
Entry Confirmation
- Max Bars After Sweep For Confirmation: limits how many bars can pass before confirmation expires.
- Require Sweep Candle Midline Break: adds midpoint-based reclaim confirmation.
- Cooldown Bars Between Signals: prevents signals from clustering too closely.
Trade Simulation
- Enable Internal Trade Simulation: enables or disables projected trade logic.
- Take Profit (Pips): projected target distance.
- Stop Loss (Pips): projected stop distance.
- Block New Signals While Trade Is Active: prevents overlapping simulated trades.
- Show Stopped Trades: controls whether stopped-out trades remain visible.
Visual Settings
- Show Signal Labels: shows or hides BUY / SELL labels.
- Show Entry Line: shows or hides the projected entry line.
- Show Status Panel: enables or disables the panel.
- Color Signal Bars: colors confirmed signal bars.
- Show Sweep Guides: enables or disables sweep-guide visuals.
- Guide Extension Bars: controls how far guides extend.
- Signal Label Size: controls label size.
- Panel Position: controls panel location. :contentReference {index=22}
IMPORTANT PRACTICAL NOTE ON PIP MODE
The script uses pip-based calculations for:
- sweep distance,
- minimum candle range,
- take-profit distance,
- stop-loss distance.
Because of that, pip interpretation is critical.
If sweeps appear too small, too large, too frequent, too rare, or if projected TP/SL distances look inconsistent for the instrument being analyzed, the first setting to verify is Pip Mode. This is especially important on gold, JPY pairs, index-style symbols, and broker-specific tick formats. :contentReference {index=23}
LIMITATIONS AND SHORTCOMINGS
This script has important limitations:
- It is a liquidity-reclaim model, not a full market-structure engine.
- It only evaluates sweeps of stored pivot-based levels.
- It does not identify fair value gaps, order blocks, or discretionary structure beyond the stored liquidity levels.
- Signal quality depends heavily on the selected wick/body/range filters.
- EMA filtering is optional and only provides one form of directional context.
- The confirmation window can materially change signal frequency and behavior.
- The simulation layer uses simplified projected TP/SL logic and is not equivalent to real execution.
- Same-bar TP/SL handling uses a rule-based priority rather than true intrabar reconstruction.
- Historical projected outcomes should not be interpreted as guaranteed tradable results.
- No sweep-based model can remove all false signals or all regime-dependent behavior.
For those reasons, the script should be used as a structured analysis and review framework, not as a promise of future profitability. :contentReference {index=24}
WHO THIS SCRIPT MAY BE USEFUL FOR
This script may be useful for traders who:
- focus on liquidity sweeps and reclaim behavior,
- want a rules-based alternative to purely discretionary sweep reading,
- want candle-quality filters in addition to simple level breaks,
- want optional EMA context for directional alignment,
- want projected entry/TP/SL structure on the chart,
- want a compact state panel for monitoring the framework.
It may be less suitable for traders who:
- want a minimal pivot-only tool,
- want a complete multi-concept smart-money framework,
- want a full execution engine,
- want historical projected results to be treated as live-performance evidence.
DISCLAIMER
This script is provided for educational and informational purposes only.
It does not constitute financial, investment, or trading advice.
Market conditions change, historical behavior does not guarantee future results, and users should perform their own analysis, validation, and risk management before using the script in live decision-making. 指標

Orderflow Synthesis Pro [JOAT]Orderflow Synthesis Pro
Introduction
The Orderflow Synthesis Pro is an advanced open-source institutional orderflow analysis indicator that combines Order Block detection, Fair Value Gap identification, Liquidity Pool mapping, and Premium/Discount Array analysis into a unified multi-dimensional flow system. This indicator helps traders identify where institutional money is positioning by analyzing price imbalances, supply/demand zones, and value arrays across the market structure.
Unlike basic support/resistance indicators that simply mark levels, this system dissects orderflow into actionable intelligence: Order Blocks reveal where institutions accumulated or distributed positions, Fair Value Gaps expose price inefficiencies that often get filled, Liquidity Pools identify where stop hunts occur, and Premium/Discount Arrays show whether price is trading at value or extremes. The indicator is designed for traders who understand that institutional footprints can be detected through systematic orderflow analysis.
Why This Indicator Exists
This indicator addresses a critical gap in retail trading: the ability to see institutional orderflow in real-time. Institutional traders leave detectable footprints through their large orders that create specific price patterns. By combining multiple orderflow methodologies, this indicator reveals:
Order Blocks: Last opposing candle before strong directional moves - marks institutional accumulation/distribution zones
Fair Value Gaps: Three-candle price imbalances where price moved too fast, leaving inefficiencies that often get filled
Liquidity Pools: Equal highs and lows where retail stops cluster - prime targets for institutional sweeps
Premium/Discount Arrays: Value zones showing whether price is expensive (premium) or cheap (discount) relative to range
Breaker Blocks: Failed Order Blocks that reverse - signal institutional trap or change in sentiment
Mitigation Blocks: Price returning to Order Blocks for retests - optimal entry opportunities
Each component provides a different lens on institutional behavior. Order Blocks show positioning, Fair Value Gaps show inefficiencies, Liquidity Pools show manipulation targets, and Value Arrays show context. Together, they create a comprehensive view of smart money activity.
Core Components Explained
1. Order Block Detection
Order Blocks represent the last opposing candle before a strong directional move. They mark zones where institutions placed large orders:
// Bullish Order Block: Last bearish candle before strong bullish move
bullishOB = close < open and close > open and
(high - low) > atr * 1.5 and
volume > avgVol * 1.3
The indicator identifies Order Blocks using three criteria:
Candle direction reversal (bearish to bullish or vice versa)
Strong momentum (candle range exceeds ATR threshold)
Volume confirmation (volume exceeds average by multiplier)
Each Order Block displays with a dark box, glowing border, and equilibrium line through the middle (50% level). Strength classification labels blocks as "STRONG" when volume exceeds 1.8x average. Order Blocks remain active until price closes through them (mitigation), at which point they're removed.
2. Fair Value Gap Analysis
Fair Value Gaps (FVGs) occur when price moves so fast that it leaves an imbalance - a gap between three consecutive candles:
// Bullish FVG: Current low > 2 candles ago high
bullishFVG = low > high
fvgSize = (low - high ) / high * 100
FVGs represent price inefficiencies where one side overwhelmed the other. The indicator:
Detects gaps with minimum size threshold (default 0.3%)
Draws semi-transparent boxes marking the imbalance zone
Tracks up to 15 active gaps simultaneously
Auto-removes gaps when price fills them (closes within the zone)
Institutions often return to fill these gaps, making them high-probability reversal or continuation zones depending on context.
3. Liquidity Pool Mapping
Liquidity Pools form at equal highs and lows where retail traders cluster their stop losses. Institutions target these zones to trigger stops before reversing:
The indicator identifies equal highs/lows using pivot detection with tolerance:
Detects swing highs and lows using configurable lookback
Compares pivots to find equal levels within tolerance percentage
Marks zones with thick horizontal lines and labels
Displays "SELL LIQ" above equal highs, "BUY LIQ" below equal lows
When price sweeps these levels and reverses, it signals institutional liquidity grab - often preceding significant moves in the opposite direction.
4. Premium/Discount Arrays
Premium/Discount Arrays classify price position relative to recent range, showing whether price is expensive or cheap:
rangeHigh = ta.highest(high, 50)
rangeLow = ta.lowest(low, 50)
rangeEQ = (rangeHigh + rangeLow) / 2
inPremium = close > rangeEQ and close > (rangeEQ + (rangeHigh - rangeEQ) * 0.5)
inDiscount = close < rangeEQ and close < (rangeEQ - (rangeEQ - rangeLow) * 0.5)
The indicator displays:
Multi-gradient background (red/orange in premium, cyan/green in discount)
Glowing iridescent equilibrium line with pulsing effect
Fibonacci-style levels at 75%, 50%, 25% of range
Dynamic adjustment as range evolves
Institutional traders typically buy in discount zones and sell in premium zones. This provides directional bias for entries.
5. Breaker Blocks
Breaker Blocks occur when an Order Block gets broken and price reverses. They signal failed institutional positioning or traps:
When a bullish Order Block breaks to the downside, it becomes a bearish Breaker Block. When a bearish Order Block breaks to the upside, it becomes a bullish Breaker Block. The indicator marks these with dotted boxes and "BREAKER" labels, showing zones where sentiment shifted.
6. Mitigation Blocks
Mitigation occurs when price returns to an Order Block for a retest. These provide optimal entry opportunities with defined risk:
The indicator marks mitigation with small "MIT" labels when price touches an active Order Block and shows rejection (bullish candle at bullish OB, bearish candle at bearish OB). This confirms the zone is holding and institutions are defending it.
Visual Elements
Order Block Boxes: Dark fill with glowing neon borders (cyan for bullish, magenta for bearish)
Equilibrium Lines: Dashed lines through Order Block midpoints
Fair Value Gap Boxes: Semi-transparent fills (green for bullish, red for bearish)
Liquidity Lines: Thick horizontal lines at equal highs/lows
Premium/Discount Background: Multi-color gradient showing value zones
Equilibrium Glow: Multi-layer iridescent line with pulsing effect
Gradient Candles: Optional candle coloring based on strength and context
Dashboard: Real-time metrics showing active zones and confluence
The dashboard displays 8 key metrics:
1. Confluence Level (Extreme/Strong/Moderate/Weak)
2. Active Order Blocks count
3. Open Imbalance Zones (FVGs)
4. Liquidity Pool count
5. Value Array position (Premium/Discount/Equilibrium)
6. Flow State (Explosive/Active/Dormant)
7. Signal Quality score (0-100)
Input Parameters
Order Block Detection:
Lookback Period: Bars to analyze for OB formation (default: 20)
Volume Multiplier: Threshold for volume confirmation (default: 1.3)
ATR Multiplier: Threshold for momentum confirmation (default: 1.5)
Maximum Active Blocks: Limit displayed OBs (default: 8)
Strength Classification: Enable/disable strength labels
Fair Value Gaps:
Minimum Gap Size: Percentage threshold for FVG detection (default: 0.3%)
Maximum Active Gaps: Limit displayed FVGs (default: 15)
Auto-Fill Detection: Remove gaps when filled
Quality Filter: All/Strong Only/Extreme Only
Liquidity Analysis:
Swing Detection Length: Pivot lookback for equal highs/lows (default: 5)
Level Tolerance: Percentage range for "equal" levels (default: 0.15%)
Show Sweep Markers: Display liquidity grab boxes
Volume Confirmation: Require volume spike for liquidity zones
Premium/Discount Arrays:
Array Lookback Period: Range calculation period (default: 50)
Fibonacci Levels: Show 75%/50%/25% levels
Dynamic Equilibrium: Adjust EQ line in real-time
Advanced Orderflow:
Volume Imbalance: Mark high-volume candles
Breaker Blocks: Show failed Order Blocks
Mitigation Blocks: Mark OB retests
Gradient Candles: Color candles by strength
How to Use This Indicator
Step 1: Identify Value Context
Check the Premium/Discount Array background. Look for entries in discount zones for longs, premium zones for shorts. The equilibrium line shows fair value.
Step 2: Locate Order Blocks
Find active Order Blocks in your direction. Bullish OBs in discount = high-probability long zones. Bearish OBs in premium = high-probability short zones.
Step 3: Watch for Fair Value Gaps
FVGs often get filled. When price approaches an FVG in your direction, prepare for potential retest entry. FVG + Order Block confluence = strongest setups.
Step 4: Monitor Liquidity Pools
Equal highs/lows are magnets for price. Expect sweeps before reversals. When price takes liquidity and shows rejection, it signals institutional positioning complete.
Step 5: Confirm with Mitigation
Wait for price to return to Order Blocks (mitigation). Enter on rejection candles at OB equilibrium lines with stops below/above the block.
Step 6: Check Confluence Score
Dashboard shows confluence level. Extreme/Strong = high-probability setups. Multiple components aligning (OB + FVG + Liquidity + Value Zone) = best entries.
Best Practices
Use on liquid instruments (major forex, large-cap stocks, major crypto) for reliable signals
Combine with higher timeframe bias - trade in direction of HTF structure
Order Blocks work best at key levels - look for OBs near support/resistance
FVG fills don't always happen immediately - be patient
Liquidity sweeps often happen at session opens (London/New York)
Premium/Discount context is critical - don't buy premium or sell discount
Breaker Blocks signal trend changes - respect them
Volume imbalance + Order Block = strongest zones
Multiple mitigation attempts weaken Order Blocks
Indicator Limitations
Orderflow analysis works best on trending markets with clear structure
Choppy, low-volume conditions produce unreliable signals
Order Blocks can fail - always use stop losses
Fair Value Gaps may not fill immediately or at all in strong trends
Liquidity sweeps can extend further than expected (stop hunts)
Premium/Discount zones are relative - not absolute support/resistance
The indicator shows where institutions likely positioned, not guaranteed future direction
Multiple Order Blocks can create conflicting signals - use confluence
Breaker Blocks require confirmation - don't trade the break alone
Technical Implementation
Built with Pine Script v6 using:
Custom Order Block detection with volume and ATR filters
Three-candle Fair Value Gap calculations
Pivot-based liquidity pool identification with tolerance
Dynamic Premium/Discount Array with gradient visualization
Breaker Block detection through OB invalidation tracking
Mitigation Block confirmation with candle pattern recognition
Real-time confluence scoring system
Advanced gradient color schemes with iridescent effects
Comprehensive dashboard with 8 real-time metrics
The code is fully open-source and can be modified to suit individual trading styles and preferences.
Originality Statement
This indicator is original in its comprehensive integration approach. While individual components (Order Blocks, Fair Value Gaps, Liquidity Pools, Premium/Discount) are established ICT concepts, this indicator is justified because:
It synthesizes four distinct orderflow methodologies into a unified system with confluence scoring
The Breaker Block detection provides failed Order Block analysis not available in standard OB indicators
Mitigation Block tracking combines OB retests with candle pattern confirmation for entry precision
The Premium/Discount Array uses multi-gradient visualization with iridescent equilibrium lines
Volume imbalance integration adds confirmation layer to all components
The confluence scoring system quantifies setup quality across all orderflow elements
Real-time dashboard presents 8 metrics simultaneously for holistic orderflow analysis
Each component contributes unique information: Order Blocks show positioning, Fair Value Gaps show inefficiencies, Liquidity Pools show manipulation, Premium/Discount shows context, Breakers show failures, and Mitigation shows retests. The indicator's value lies in presenting these complementary perspectives simultaneously with unified classification and visual hierarchy.
Disclaimer
This indicator is provided for educational and informational purposes only. It is not financial advice or a recommendation to buy or sell any financial instrument. Trading involves substantial risk of loss and is not suitable for all investors.
Orderflow analysis is a tool for understanding market dynamics, not a crystal ball for predicting future price movement. Order Blocks do not guarantee reversals. Fair Value Gaps may not fill. Liquidity sweeps can fail. Past orderflow patterns do not guarantee future orderflow patterns. Market conditions change, and strategies that worked historically may not work in the future.
The zones displayed are analytical constructs based on current market data, not predictions of future price movement. High confluence scores do not guarantee profitable trades. Users must conduct their own analysis and risk assessment before making trading decisions.
Always use proper risk management, including stop losses and position sizing appropriate for your account size and risk tolerance. Never risk more than you can afford to lose. Consider consulting with a qualified financial advisor before making investment decisions.
The author is not responsible for any losses incurred from using this indicator. Users assume full responsibility for all trading decisions made using this tool.
-Made with passion by officialjackofalltrades 指標

Liquidity Structure Mapper [JOAT]Liquidity Structure Mapper
Introduction
The Liquidity Structure Mapper is an advanced market structure analysis tool designed to identify and visualize the key levels where institutional traders place their orders. This indicator goes beyond simple support and resistance by detecting swing points, equal highs/lows, liquidity zones, and the patterns that reveal professional market participation. Understanding market structure and liquidity is fundamental to successful trading - institutions don't enter at random levels, they hunt liquidity at specific price points, and this tool reveals those locations.
This indicator is built for traders who understand that markets are driven by liquidity - the accumulation and distribution of orders at key levels. Whether you're a day trader timing entries at structure, a swing trader identifying major turning points, or a position trader mapping long-term levels, this mapper provides the institutional-grade structural analysis needed to trade with the smart money rather than against it.
Why This Indicator Exists
Most traders draw support and resistance lines arbitrarily or use basic pivot points without understanding the underlying liquidity dynamics. This indicator addresses that limitation by:
Swing Point Detection: Identifies true market structure turning points
Equal Level Analysis: Finds equal highs and lows that form liquidity pools
Liquidity Zone Mapping: Visualizes areas of concentrated order flow
Zone Strength Scoring: Quantifies the reliability of each level
Sweep Detection: Identifies liquidity grabs before reversals
Proximity Analysis: Shows distance to nearest key levels
The mapper transforms abstract market structure concepts into concrete, actionable levels with measurable strength and reliability.
Core Components Explained
1. Swing Point Detection
The indicator identifies true swing points using pivot analysis:
// Swing point detection
float pivot_high = ta.pivothigh(high, i_swing_left, i_swing_right)
float pivot_low = ta.pivotlow(low, i_swing_left, i_swing_right)
// Process new swing high
if not na(pivot_high) and barstate.isconfirmed
int pivot_bar = bar_index - i_swing_right
SwingPoint new_sh = SwingPoint.new()
new_sh.price := pivot_high
new_sh.bar_idx := pivot_bar
new_sh.direction := 1
new_sh.is_valid := true
Swing features:
Left Bars: Bars to the left of pivot (default: 10)
Right Bars: Bars to the right for confirmation (default: 5)
Validation: Only confirmed swing points are marked
Visual Markers: Clear labels showing price and level type
Historical Tracking: Maintains history of all swing points
True swing points represent where the market actually changed direction - these are the foundation of market structure.
2. Equal Highs/Lows Detection
The indicator finds equal levels that form liquidity zones:
f_find_equal_levels(array swings, float threshold, int zone_type, color zone_col, float atr_val) =>
int sz = array.size(swings)
if sz >= 2 and barstate.isconfirmed
SwingPoint latest = array.get(swings, sz - 1)
for i = 0 to sz - 2
SwingPoint compare = array.get(swings, i)
if compare.is_valid and latest.is_valid
float pct = f_pct_diff(latest.price, compare.price)
if pct <= threshold
// Found equal level - create liquidity zone
float zone_top = math.max(latest.price, compare.price)
float zone_bottom = math.min(latest.price, compare.price)
// Add ATR buffer to zone
zone_top := zone_top + atr_val * 0.1
zone_bottom := zone_bottom - atr_val * 0.1
Equal level features:
Threshold: Percentage tolerance for equality (default: 0.1%)
Zone Creation: Forms zones around equal levels
ATR Buffer: Adds small buffer based on volatility
Zone Types: EQH (equal highs) and EQL (equal lows)
Liquidity Pools: Areas where stops cluster
Equal highs/lows are where stop losses and pending orders accumulate - they're liquidity magnets.
3. Liquidity Zone Management
The indicator tracks and manages liquidity zones dynamically:
// Zone interaction tracking
if array.size(liq_zones) > 0 and barstate.isconfirmed
for i = array.size(liq_zones) - 1 to 0
LiquidityZone zone = array.get(liq_zones, i)
if zone.is_active
// Check if price swept the zone
bool swept_high = zone.zone_type == 1 and high > zone.top
bool swept_low = zone.zone_type == -1 and low < zone.bottom
// Update zone age
zone.age_bars := zone.age_bars + 1
// Check for zone touches
bool touching_high = zone.zone_type == 1 and high >= zone.bottom and high <= zone.top
bool touching_low = zone.zone_type == -1 and low <= zone.top and low >= zone.bottom
if (touching_high or touching_low) and not (swept_high or swept_low)
zone.touch_count := zone.touch_count + 1
Zone features:
Active Zones: Zones that haven't been swept yet
Touch Count: Number of times price has tested the zone
Zone Age: How long the zone has existed
Sweep Detection: Identifies when liquidity is taken
Strength Updates: Zones get stronger with more touches
Zones that are tested multiple times become stronger and more significant.
4. Zone Strength Calculation
Each zone is assigned a strength score:
f_calc_zone_strength(int touches, int age, float zone_width, float atr_val) =>
float touch_score = math.min(float(touches) / 5.0 * 40, 40)
float age_score = math.max(30 - float(age) / 50.0 * 30, 0)
float width_score = math.min(atr_val / zone_width * 30, 30)
touch_score + age_score + width_score
Strength components:
Touch Score: More touches = stronger level (max 40 points)
Age Score: Fresher zones are more relevant (max 30 points)
Width Score: Tighter zones are more precise (max 30 points)
Total Strength: 0-100 indicating zone reliability
Visual Updates: Zone color intensifies with strength
Strength scoring helps prioritize which levels deserve more attention.
5. Structure Analysis Metrics
The indicator calculates structural relationships:
// Calculate structure metrics
float nearest_resistance = na
float nearest_support = na
// Find nearest resistance above current price
if array.size(swing_highs) > 0
for i = array.size(swing_highs) - 1 to 0
SwingPoint sh = array.get(swing_highs, i)
if sh.price > close and (na(nearest_resistance) or sh.price < nearest_resistance)
nearest_resistance := sh.price
// Find nearest support below current price
if array.size(swing_lows) > 0
for i = array.size(swing_lows) - 1 to 0
SwingPoint sl = array.get(swing_lows, i)
if sl.price < close and (na(nearest_support) or sl.price > nearest_support)
nearest_support := sl.price
// Structure bias calculation
float structure_bias = 0.0
if not na(dist_to_resistance) and not na(dist_to_support)
structure_bias := (dist_to_support - dist_to_resistance) /
(dist_to_support + dist_to_resistance)
Metrics include:
Nearest Resistance: Closest swing high above price
Nearest Support: Closest swing low below price
Distance Percentages: How far price is from each level
Structure Bias: Overall structural directional bias
Proximity Score: How close price is to key levels
These metrics provide context for current price position within the structure.
6. Proximity Analysis System
The indicator measures how close price is to key levels:
f_proximity_score(float price, float zone_top, float zone_bot) =>
float zone_mid = (zone_top + zone_bot) / 2
float dist = math.abs(price - zone_mid)
float zone_height = zone_top - zone_bot
math.max(100 - (dist / zone_height * 100), 0)
// Dynamic proximity labels
if i_show_prox_labels and barstate.islast
if not na(nearest_resistance) and resistance_proximity > 30
string res_label = "RESISTANCE " + str.tostring(nearest_resistance, "#.##") +
" Proximity: " + str.tostring(resistance_proximity, "#") + "%"
Proximity features:
Proximity Score: 0-100% showing closeness to levels
Dynamic Labels: Shows level price and proximity
Warning System: Alerts when approaching key levels
Background Colors: Visual warnings at high proximity
Distance Tracking: Real-time distance monitoring
Proximity analysis helps prepare for potential reactions at key levels.
Visual Elements
Swing Points: Clear markers for highs and lows with labels
Liquidity Zones: Color-coded zones with glow effects
Zone Strength: Visual intensity based on reliability
Swept Zones: Different styling for taken liquidity
Proximity Labels: Dynamic labels showing nearest levels
Warning Markers: Visual alerts at key level approaches
Dashboard: Comprehensive structure metrics
Background Shading: Subtle warnings at critical levels
The dashboard displays:
1. Active EQH and EQL zone counts
2. Nearest support and resistance levels
3. Proximity percentages to key levels
4. Zone strength distribution
5. Structure bias and metrics
6. Recent sweep activity
7. Level age and touch statistics
8. Trading recommendations based on structure
Input Parameters
Swing Detection:
Left Bars: Pivot lookback period (default: 10)
Right Bars: Confirmation period (default: 5)
Max Swings: Maximum swing levels to track (default: 20)
Show Swings: Display swing point markers
Equal Levels:
Equal Threshold: Percentage tolerance (default: 0.1%)
Show EQH/EQL: Display equal high/low zones
Zone Extension: How far zones extend (default: 50 bars)
Zone Settings:
Show Zones: Display liquidity zones
Zone Lookback: Historical zone tracking (default: 100)
Min Touches: Minimum touches for strength (default: 2)
ATR Buffer: Zone size multiplier (default: 0.15)
Visual Settings:
Color Scheme: Customizable colors for all elements
Glow Effects: Enable visual enhancements
Label Sizes: Adjustable text sizes
Dashboard Display: Show/hide metrics panel
How to Use This Indicator
Step 1: Identify Key Structure
Start by identifying major swing highs and lows. These form the foundation of market structure and define the overall market direction.
Step 2: Locate Liquidity Zones
Look for equal highs and lows that form liquidity zones. These are where stop losses accumulate and where institutions often target for liquidity grabs.
Step 3: Assess Zone Strength
Pay attention to zone strength scores. Zones with multiple touches (3+) and high strength (>70%) are more reliable for reactions.
Step 4: Monitor for Sweeps
Watch for price sweeping liquidity zones (breaking slightly beyond levels) and then reversing. These are often reversal signals.
Step 5: Use Proximity Analysis
When price approaches key levels (proximity > 70%), prepare for potential reactions. This is where entries or exits should be considered.
Step 6: Track Structure Bias
The structure bias shows whether price is closer to support or resistance. This can guide your directional bias.
Best Practices
The most reliable levels have multiple touches and high strength scores
Liquidity grabs (sweeps) often precede strong reversals
Fresh zones (newly formed) are often more significant than old ones
Combine structure with price action for confirmation
Higher timeframe structure overrides lower timeframe levels
Zone strength increases with each successful test
Be cautious at zones with very wide spreads - they're less precise
Watch for clusters of zones - these form major support/resistance areas
Keep a structure journal to track which levels hold best
Use structure for stop placement - just beyond key levels
4HR TF On BTC:
Trading Applications
Support/Resistance Trading:
Enter long near strong support zones
Enter short near strong resistance zones
Place stops just beyond the zone boundaries
Target the opposite zone or midpoint
Breakout Trading:
Wait for clear breaks of structure
Confirm with volume and momentum
Enter on retests of broken levels
Use zones as new support/resistance
Reversal Trading:
Look for liquidity sweeps beyond zones
Enter on first signs of reversal
Confirm with candlestick patterns
Target the opposite structure level
Strategy Integration
This indicator enhances any trading system:
Use structure levels for stop placement
Filter trades based on proximity to key levels
Time entries at strong support/resistance
Identify high-probability reversal zones
Export structure metrics for custom logic
Combine with trend analysis for optimal results
Technical Implementation
Built with Pine Script v6 featuring:
Advanced swing point detection with pivot analysis
Equal level identification with customizable thresholds
Dynamic liquidity zone management and tracking
Zone strength scoring with multiple factors
Real-time proximity analysis and warnings
Comprehensive structure metrics calculation
Visual effects including glow and gradient fills
Interactive dashboard with 8 key metrics
Alert conditions for all major structural events
Export functions for strategy integration
The code uses confirmed bars for all calculations to prevent repainting and ensure reliable structure identification.
Originality Statement
This indicator is original in its comprehensive approach to liquidity structure analysis and zone management. While swing point detection is a known concept, this indicator is justified because:
It synthesizes swing analysis with equal level detection to identify liquidity zones
The zone strength scoring system provides objective measures of level reliability
Dynamic zone management tracks the lifecycle of each liquidity area
Proximity analysis adds practical trading context to structure identification
Sweep detection identifies the patterns of liquidity grabs
The dashboard presents complex structural analysis in an accessible format
Visual elements including glow effects and gradients enhance readability
Export functions enable integration with any trading system
Each component provides unique insights: swing points show structure, equal levels show liquidity, strength shows reliability, and proximity shows opportunity
The indicator solves the real problem of identifying where institutions place orders rather than just drawing arbitrary lines
The indicator's value lies in transforming abstract market structure concepts into concrete, actionable levels with measurable properties that traders can use to make informed decisions about entries, exits, and risk management.
Disclaimer
This indicator is provided for educational and informational purposes only. It is not financial advice or a recommendation to buy or sell any financial instrument. Market structure analysis is a tool for understanding price levels, not a prediction system.
Support and resistance levels can break without warning due to news events, economic data, or changes in market sentiment. Past reactions at levels do not guarantee future behavior. The indicator's levels are mathematical calculations based on historical price action and should be used in conjunction with other forms of analysis.
Always use proper risk management, including stop losses placed beyond key levels. Never assume a level will hold - always have a plan for when it breaks. Liquidity zones can be swept multiple times before a final reversal.
The author is not responsible for any losses incurred from using this indicator. Users assume full responsibility for all trading decisions made using this system.
-Made with passion by officialjackofalltrades
指標