PINE LIBRARY
Liquidity Finder Library
🔵Introduction
You may intend to utilize the "Liquidity" detection capability in your indicators. Instead of writing it, you can import the "Liquidity Finder" library into your code. One of the advantages of this approach is time-saving and reduction in scripting errors.
🔵Key Features
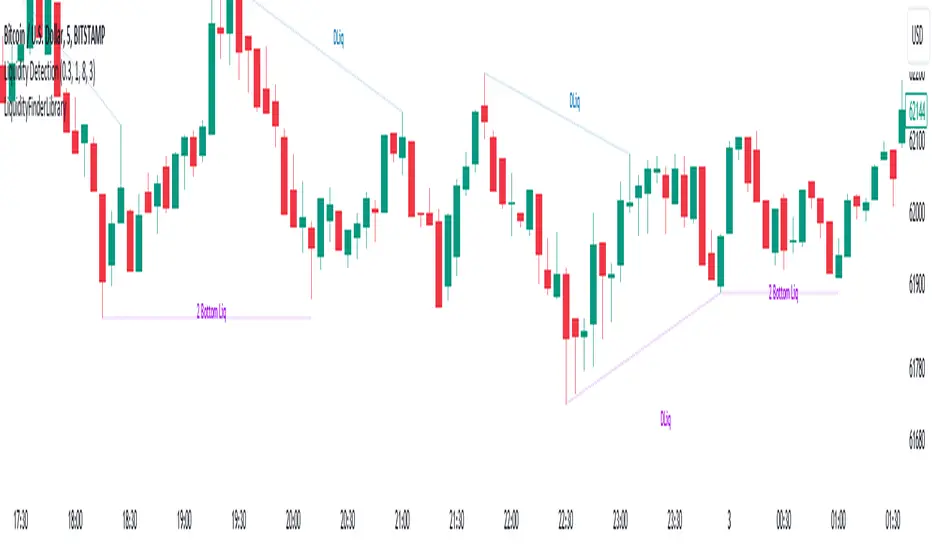
Identification of "Statics Liquidity"
Identification of "Dynamics Liquidity"
🔵How to Use
Firstly, you can add the library to your code as shown in the example below:
Pine Script®
The parameters of the "LLF" function are as follows:
sPP: A float variable ranging from 0 to 0.4. Increasing this number decreases the sensitivity of the "Statics Liquidity Line Detection" function and increases the number of detected lines. The default value is 0.3.
dPP: A float variable ranging from 0.4 to 1.95. Increasing this number increases the sensitivity of the "Dynamics Liquidity Line Detection" function and decreases the number of detected lines. The default value is 1.
SRs: An int variable. By default, it's set to 8. You can change this number to specify the periodicity of static liquidity pivot lines.
SRd: An int variable. By default, it's set to 3. You can change this number to specify the periodicity of dynamic liquidity pivot lines.
ShowHLLs: A bool variable. You can enable or disable the display of "High Statics Liquidity Line".
ShowLLLs: A bool variable. You can enable or disable the display of "Low Statics Liquidity Line".
ShowHLLd: A bool variable. You can enable or disable the display of "High Dynamics Liquidity Line".
ShowLLd: A bool variable. You can enable or disable the display of "High Dynamics Liquidity Line".
🟣Recommendation
You can use the following code snippet to import Liquidity Finder into your code for time-saving.
Pine Script®
You may intend to utilize the "Liquidity" detection capability in your indicators. Instead of writing it, you can import the "Liquidity Finder" library into your code. One of the advantages of this approach is time-saving and reduction in scripting errors.
🔵Key Features
Identification of "Statics Liquidity"
Identification of "Dynamics Liquidity"
🔵How to Use
Firstly, you can add the library to your code as shown in the example below:
import TFlab/LiquidityFinderLibrary/1 as Liq
The parameters of the "LLF" function are as follows:
sPP: A float variable ranging from 0 to 0.4. Increasing this number decreases the sensitivity of the "Statics Liquidity Line Detection" function and increases the number of detected lines. The default value is 0.3.
dPP: A float variable ranging from 0.4 to 1.95. Increasing this number increases the sensitivity of the "Dynamics Liquidity Line Detection" function and decreases the number of detected lines. The default value is 1.
SRs: An int variable. By default, it's set to 8. You can change this number to specify the periodicity of static liquidity pivot lines.
SRd: An int variable. By default, it's set to 3. You can change this number to specify the periodicity of dynamic liquidity pivot lines.
ShowHLLs: A bool variable. You can enable or disable the display of "High Statics Liquidity Line".
ShowLLLs: A bool variable. You can enable or disable the display of "Low Statics Liquidity Line".
ShowHLLd: A bool variable. You can enable or disable the display of "High Dynamics Liquidity Line".
ShowLLd: A bool variable. You can enable or disable the display of "High Dynamics Liquidity Line".
🟣Recommendation
You can use the following code snippet to import Liquidity Finder into your code for time-saving.
//import Library
import TFlab/LiquidityFinderLibrary/1 as Liq
//input
SLLS = input.float(0.30 , 'Statics Liquidity Line Sensitivity', maxval = 0.4 ,minval = 0.0, step = 0.01) // Statics Liquidity Line Sensitivity
DLLS = input.float(1.00 , 'Dynamics Liquidity Line Sensitivity', maxval = 1.95 ,minval = 0.4, step = 0.01) // Dynamics Liquidity Line Sensitivity
SPP = input.int(8 , 'Statics Period Pivot') // Statics Period Pivot
DPP = input.int(3 , 'Dynamics Period Pivot') // Dynamics Period Pivot
ShowSHLL = input.bool(true , 'Show Statics High Liquidity Line')
ShowSLLL = input.bool(true , 'Show Statics Low Liquidity Line')
ShowDHLL = input.bool(true , 'Show Dynamics High Liquidity Line')
ShowDLLL = input.bool(true , 'Show Dynamics Low Liquidity Line')
//call function
Liq.LLF(SPP,DPP,SLLS,DLLS,ShowSHLL,ShowSLLL,ShowDHLL,ShowDLLL)
Pine腳本庫
秉持 TradingView 一貫的共享精神,作者將此 Pine 程式碼發佈為開源庫,讓社群中的其他 Pine 程式設計師能夠重複使用。向作者致敬!您可以在私人專案或其他開源發佈中使用此庫,但在公開發佈中重複使用該程式碼需遵守社群規範。
Get Access to TradingFinder indicators and Tools [29 FX Tools] FREE: tradingFinder.com/
Free Forex, Crypto & Stock Trading tutorial (Forex School), access to ICT, Smart Money & Price Action:
tradingfinder.com/education/forex/
Free Forex, Crypto & Stock Trading tutorial (Forex School), access to ICT, Smart Money & Price Action:
tradingfinder.com/education/forex/
免責聲明
這些資訊和出版物並不意味著也不構成TradingView提供或認可的金融、投資、交易或其他類型的意見或建議。請在使用條款閱讀更多資訊。