PROTECTED SOURCE SCRIPT
已更新 Instabots previous highs and lows
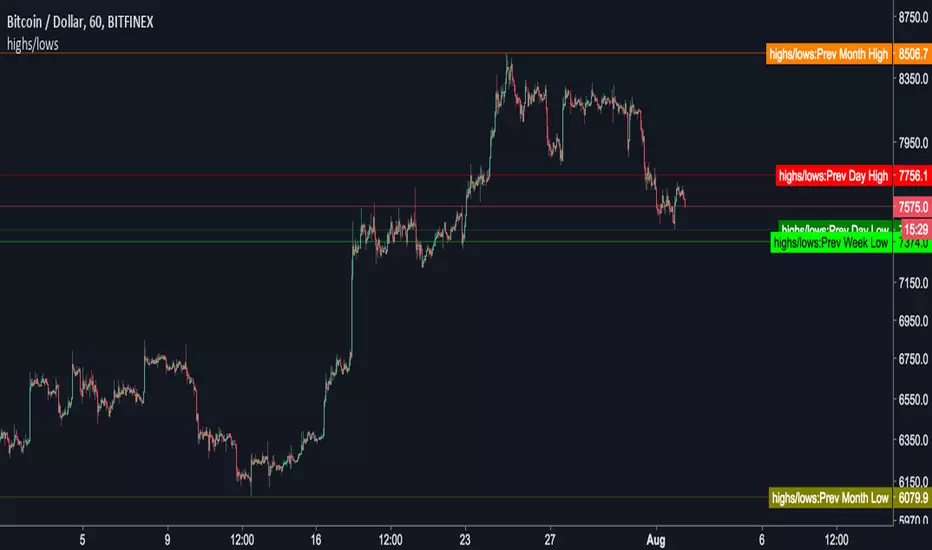
Adds previous daily, weekly and monthly highs and lows to the chart.
By default it just adds the price line to the chart. Change the default option to plot the highs and lows onto the chart, like below...

By default it just adds the price line to the chart. Change the default option to plot the highs and lows onto the chart, like below...
發行說明
Default colours are a little better, plus the labels are more compact when showing indicator labels.發行說明
tweaked發行說明
S & R colour coding wrong way round受保護腳本
此腳本以閉源形式發佈。 不過,您可以自由使用,沒有任何限制 — 點擊此處了解更多。
免責聲明
這些資訊和出版物並非旨在提供,也不構成TradingView提供或認可的任何形式的財務、投資、交易或其他類型的建議或推薦。請閱讀使用條款以了解更多資訊。
免責聲明
這些資訊和出版物並非旨在提供,也不構成TradingView提供或認可的任何形式的財務、投資、交易或其他類型的建議或推薦。請閱讀使用條款以了解更多資訊。