INVITE-ONLY SCRIPT
已更新 PT TMA Bands

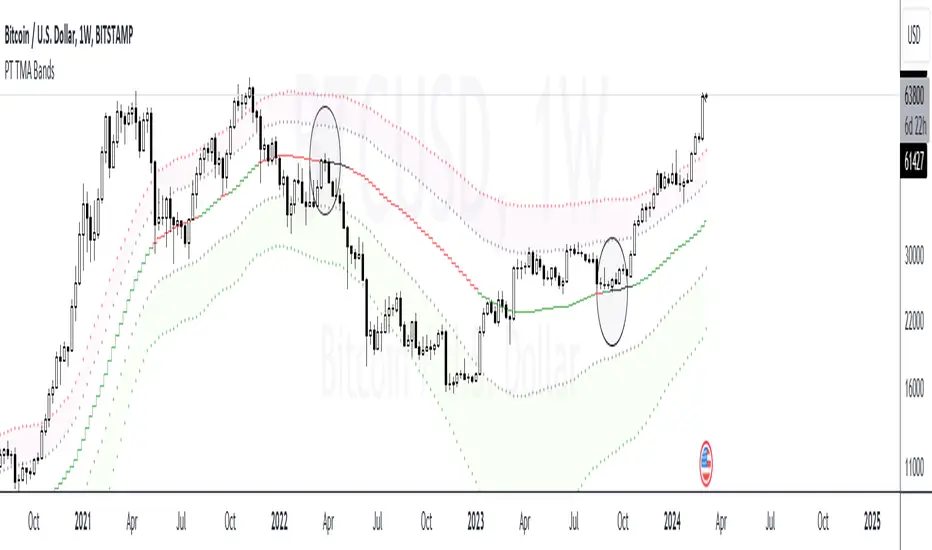
Version 1.0 of our TMA Bands is a visual of areas of interest. The purpose of this indicator is to determine where the price will likely bounce or reject. When an asset is ranging, it very well respects the neutral (middle) zone. The highest RR trade setups are when the price goes from one end of the bands to another.
The bands included are of an ATR multiplier based on multiple moving averages. Each moving average has a unique feature that offers a high probability reaction when price gravitates towards it. We have color-coordinated the bands into three zones. The Main zone being the middle area where the asset tends to play ping pong & range, Top zone, which offers the best RR for shorts & the bottom zone, which provides the best RR for longs.
Strategy:
When scalping or swinging, always look for shorts close to the red zone as possible with a stop loss above the red band. When longing, always look for longs close to the green zone area with a stop loss below the green band. Anything in orange is a neutral zone, which will confirm the asset is more than likely ranging. I don’t advise taking trades in that zone unless you have solid risk management. When playing the macros, H12+ always look for price to find support at the orange (middle) band before deciding on a shift in trend. If the asset breaks down from the orange (middle) band, you usually get a retest of that band before further downside. Also, something to consider, if you punt longs at the green zone, you want to target the orange (middle) band. If you punt shorts at the red zone, you want to target the orange (middle) band. I usually take 70% off at the middle band & let the rest run if ultimately end up in the opposite zone.
This Oscillator is best with the buy/sell signals we provide. It offers extra confluence with stop loss & targets. I enjoy using it on all time frames for swinging & scalping. It is included as part of the library. Just message us for access!
發行說明
V 2.0-Added trend logic to mid band for trend visual. Green for bullish trend, Red for bearish trend, Gray for neutral.
發行說明
V 2.1-Added alerts for top/bottom band
發行說明
V 2.2-Added multi timeframe feature
發行說明
V 2.3-Added second middle band feature
僅限邀請腳本
只有經作者授權的使用者才能訪問此腳本,且通常需付費。您可以將此腳本加入收藏,但需先向作者申請並獲得許可後才能使用 — 點擊此處了解更多。如需更多詳情,請依照作者說明或直接聯繫patterntraders。
除非您完全信任其作者並了解腳本的工作原理,否則TradingView不建議您付費或使用腳本。您也可以在我們的社群腳本中找到免費的開源替代方案。
作者的說明
Just message us for access!
提醒:在請求訪問權限之前,請閱讀僅限邀請腳本指南。
Join our telegram & discord for updates on our indicators & setups
✔ Website: whop.com/patterntraders
✔ Telegram: t.co/svvfkV3H7I?amp=1
✔ Discord: discord.gg/bqvYxc3
✔ Twitter: twitter.com/onlypatterns
✔ Website: whop.com/patterntraders
✔ Telegram: t.co/svvfkV3H7I?amp=1
✔ Discord: discord.gg/bqvYxc3
✔ Twitter: twitter.com/onlypatterns
免責聲明
這些資訊和出版物並不意味著也不構成TradingView提供或認可的金融、投資、交易或其他類型的意見或建議。請在使用條款閱讀更多資訊。