OPEN-SOURCE SCRIPT
已更新 RaenonX - NQ 7 Dashboard
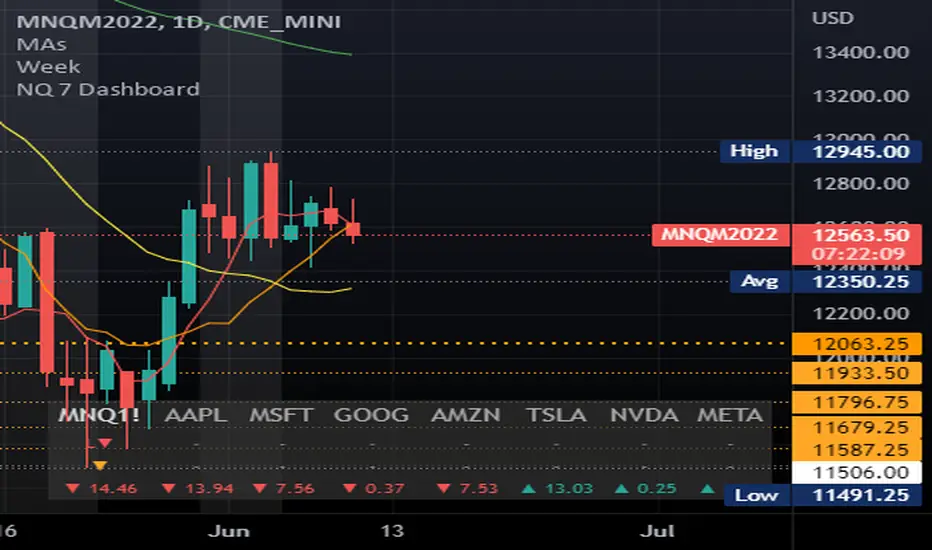
Places a table at the bottom right side showing the top 7 stocks (AAPL, MSFT, GOOG, AMZN, TSLA, NVDA, FB) current position for the given MA and daily position.
The 2nd row shows the current position related to the prior day open/high/low. There are 4 possible values:
The 3rd row shows the current position related to the given SMA parameters. The default period is 22 using 5 minutes timeframe. There are 4 possible values:
The 2nd row shows the current position related to the prior day open/high/low. There are 4 possible values:
- H+: Higher than the prior day high - indicates bullish in daily timeframe.
- O+: Higher than the prior day open - indicates pro-bullish consolidation in daily timeframe.
- L+: Higher than the prior day low - indicates pro-bearish consolidation in daily timeframe.
- L-: Lower than the prior day high - indicates bearish in daily timeframe.
The 3rd row shows the current position related to the given SMA parameters. The default period is 22 using 5 minutes timeframe. There are 4 possible values:
- B+: Higher than the SMA upper band - indicates bullish movement.
- +: Higher than the SMA - indicates pro-bullish movement, possibly consolidating.
- -: Lower than the SMA - indicates pro-bearish movement, possibly consolidating.
- B-: Lower than the SMA lower band - indicates bearish movement.
發行說明
Updated band StDev input step.發行說明
Updated symbols & disabled stock out of regular session regardless the settings. 發行說明
Added index influence value & Optimized performance.發行說明
Hides main 7 stocks of NDX out of stock trading session (including pre-market and post-market).發行說明
Replaced position buffering mechanism with Amplitude (was using the same mechanism of Bollinger Bands).發行說明
Updated ticker from FB to META.開源腳本
本著TradingView的真正精神,此腳本的創建者將其開源,以便交易者可以查看和驗證其功能。向作者致敬!雖然您可以免費使用它,但請記住,重新發佈程式碼必須遵守我們的網站規則。
免責聲明
這些資訊和出版物並不意味著也不構成TradingView提供或認可的金融、投資、交易或其他類型的意見或建議。請在使用條款閱讀更多資訊。
免責聲明
這些資訊和出版物並不意味著也不構成TradingView提供或認可的金融、投資、交易或其他類型的意見或建議。請在使用條款閱讀更多資訊。