OPEN-SOURCE SCRIPT
The Bounded Slope Indicator
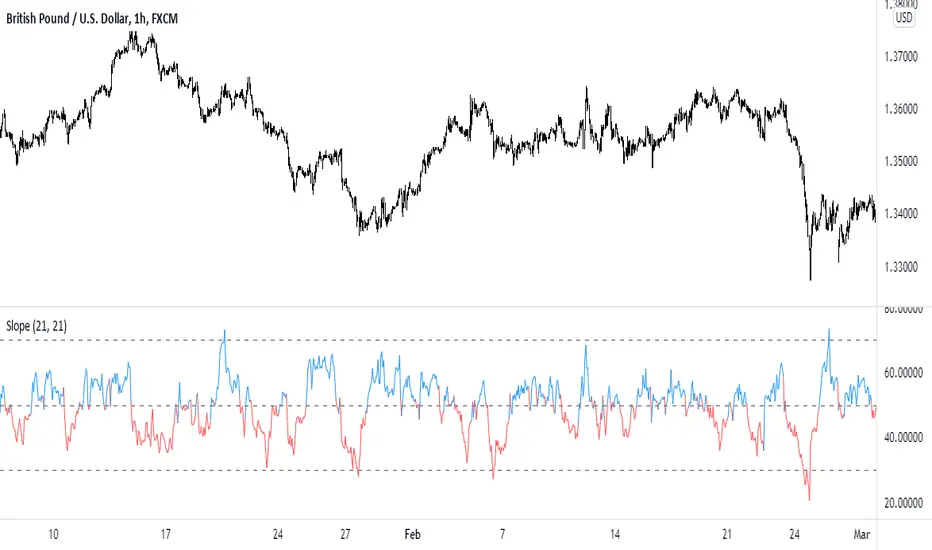
This indicator uses the concept of slopes and normalizes the values so that they are bounded between 0 and 100. The steps required to calculate the indicator are as follows:
* Calculate the slope of the price using a lookback period (by default, it is either 14 or 21). The slope is calculated by subtracting the current close price from the close price 21 (or 14) periods ago and dividing the result by 21 (or 14).
* Calculate the RSI of the slope calculations to get a normalized slope indicator.
The bounded slope indicator can be used the same way as the RSI:
* Through oversold and overbought levels. A bullish bias is present whenever the indicator is close to its oversold level (by default, it is 30) and a bearish bias is present whenever the indicator is close to its overbought level (by default, it is 70).
* Through the divergence technique. A bullish bias is present whenever the indicator is making higher lows and the market is making lower lows. A bearish bias is present whenever the indicator is making lower highs and the market is making higher highs.
The main advantage of the indicator is its different approach to measuring momentum which can be a good uncorrelated indicator to other classical ones (such as the stochastic oscillator and the MACD).
開源腳本
秉持TradingView一貫精神,這個腳本的創作者將其設為開源,以便交易者檢視並驗證其功能。向作者致敬!您可以免費使用此腳本,但請注意,重新發佈代碼需遵守我們的社群規範。
免責聲明
這些資訊和出版物並非旨在提供,也不構成TradingView提供或認可的任何形式的財務、投資、交易或其他類型的建議或推薦。請閱讀使用條款以了解更多資訊。
開源腳本
秉持TradingView一貫精神,這個腳本的創作者將其設為開源,以便交易者檢視並驗證其功能。向作者致敬!您可以免費使用此腳本,但請注意,重新發佈代碼需遵守我們的社群規範。
免責聲明
這些資訊和出版物並非旨在提供,也不構成TradingView提供或認可的任何形式的財務、投資、交易或其他類型的建議或推薦。請閱讀使用條款以了解更多資訊。