OPEN-SOURCE SCRIPT
Discrete Fourier Transform Overlay [wbburgin]
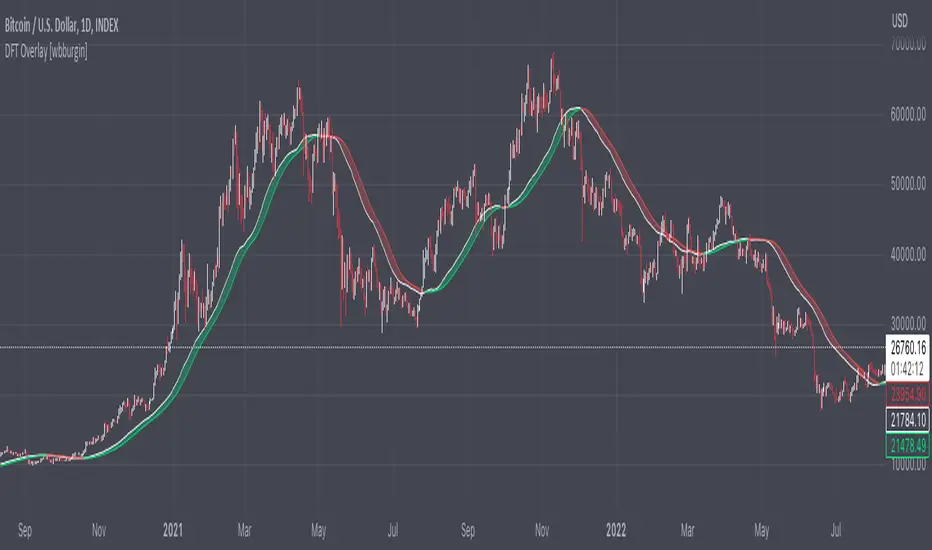
The discrete Fourier transform (DFT) overlay uses a discrete Fourier transform algorithm to identify trend direction. This is a simpler interpretation that only uses the magnitude of the first frequency component obtained from the DFT algorithm, but can be useful for visualization purposes. I haven't seen many Fourier scripts on TradingView that actually have the magnitude plotted on the chart (some have lines, for instance, but that makes it difficult to look into the past or to see previous lines).
About the Discrete Fourier Transform
The DFT is a mathematical transformation that decomposes a time-domain signal into its constituent frequency components. By applying the DFT to OHLC data, we can interpret the periodicities and trends present in the market. I've designed the overlay so that you can choose your source for the Fourier transform, as well as the length.
Settings and Configuration
The "Fourier Period" is the transform length of the DFT algorithm. This input indicates the number of data points considered for the DFT calculation. For example, if this input is set to 20, the DFT will be performed on the most recent 20 data points of the input series. The transform length affects the resolution and accuracy of the frequency analysis. A shorter transform length may provide a broader frequency range but with less detail, while a longer transform length can provide finer frequency resolution but may be computationally more intensive (I recommend using under 100 - anything above that might take too much time to load on the platform).
The "Fourier X Series" is the source you want the Fourier transform to be applied to. I have it set in default to the close.
"Kernel Smoothing" is the bar-start of the rational quadratic kernel used to smooth the frequency component. Think of it just like a normal moving average if you are unfamiliar with the concept, it functions similarly to the "length" value of a moving average.
開源腳本
本著TradingView的真正精神,此腳本的創建者將其開源,以便交易者可以查看和驗證其功能。向作者致敬!雖然您可以免費使用它,但請記住,重新發佈程式碼必須遵守我們的網站規則。
FAQ: I am gradually phasing out my Patreon because of the time it takes to maintain.
BTC: 35PdMMMXFCvPjXKwn8wsRFNwMEPgStaKUJ
Test my strategies on CryptoRobotics: cryptorobotics.co/?trade=f23b09
BTC: 35PdMMMXFCvPjXKwn8wsRFNwMEPgStaKUJ
Test my strategies on CryptoRobotics: cryptorobotics.co/?trade=f23b09
免責聲明
這些資訊和出版物並不意味著也不構成TradingView提供或認可的金融、投資、交易或其他類型的意見或建議。請在使用條款閱讀更多資訊。