OPEN-SOURCE SCRIPT
Trend-Filter [John Ehlers]
Indicator Description — Trend-Filter [John Ehlers]
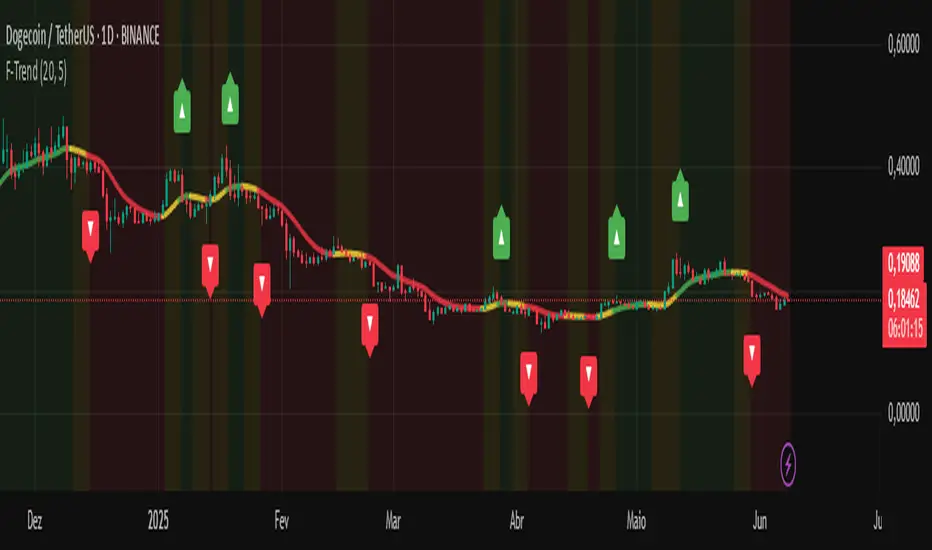
This indicator uses the SuperSmoother filter, created by John Ehlers, to smooth price data and identify trends with greater accuracy and less noise. It counts the number of consecutive bars in uptrend or downtrend to measure the strength of the movement and changes the line and background colors for easy visualization.
How to use this indicator:
SuperSmoother filter: smooths the price to reveal a clearer trend direction by filtering out fast oscillations and market noise.
Bar counting: monitors sequences of bars maintaining an up or down trend to identify consistent moves.
Dynamic colors:
Green line indicates a strong uptrend.
Red line indicates a strong downtrend.
Yellow line shows a neutral or undefined trend.
Optional colored background visually reinforces trend strength with transparency so it does not interfere with price reading.
Visual signals: arrows appear on the chart to mark the start of a strong trend, helping entry or exit decisions.
Adjustable parameters:
SuperSmoother Length: controls the filter smoothing (higher = smoother, less noise).
Trend Threshold: minimum number of consecutive bars to consider a strong trend.
Smooth colors: enable or disable line color smoothing.
Show signals: toggle trend start arrows on/off.
Show dynamic background: toggle the colored background indicating trend strength.
Recommendations:
Use alongside other technical analysis tools and risk management.
Can be applied on any timeframe, but interpretation is more reliable on charts with reasonable data volume.
Ideal for traders seeking to identify consistent trends and avoid market noise.
開源腳本
秉持TradingView一貫精神,這個腳本的創作者將其設為開源,以便交易者檢視並驗證其功能。向作者致敬!您可以免費使用此腳本,但請注意,重新發佈代碼需遵守我們的社群規範。
免責聲明
這些資訊和出版物並非旨在提供,也不構成TradingView提供或認可的任何形式的財務、投資、交易或其他類型的建議或推薦。請閱讀使用條款以了解更多資訊。
開源腳本
秉持TradingView一貫精神,這個腳本的創作者將其設為開源,以便交易者檢視並驗證其功能。向作者致敬!您可以免費使用此腳本,但請注意,重新發佈代碼需遵守我們的社群規範。
免責聲明
這些資訊和出版物並非旨在提供,也不構成TradingView提供或認可的任何形式的財務、投資、交易或其他類型的建議或推薦。請閱讀使用條款以了解更多資訊。