OPEN-SOURCE SCRIPT
RSI XTR with selective candle color by Edwin K
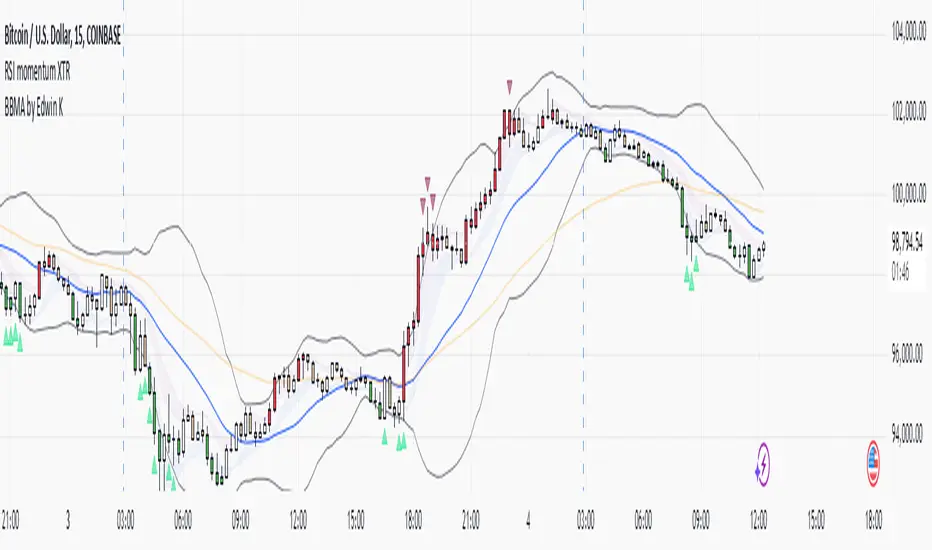
This tradingView indicator named "RSI XTR with selective candle color", which modifies the candle colors on the chart based on RSI (Relative Strength Index) conditions. Here's how it works:
- rsiPeriod: Defines the RSI calculation period (default = 5).
- rsiOverbought: RSI level considered overbought (default = 70).
- rsiOversold: RSI level considered oversold (default = 30).
- These values can be modified by the user in the settings.
RSI Calculation
- Computes the RSI value using the ta.rsi() function on the closing price (close).
- The RSI is a momentum indicator that measures the magnitude of recent price changes.
Conditions for Candle Coloring
- when the RSI is above the overbought level.
- when the RSI is below the oversold level.
How It Works in Practice
- When the RSI is above 70 (overbought) → Candles turn red.
- When the RSI is below 30 (oversold) → Candles turn green.
- If the RSI is between 30 and 70, the candle keeps its default color.
This helps traders quickly spot potential reversal zones based on RSI momentum.
開源腳本
秉持TradingView一貫精神,這個腳本的創作者將其設為開源,以便交易者檢視並驗證其功能。向作者致敬!您可以免費使用此腳本,但請注意,重新發佈代碼需遵守我們的社群規範。
免責聲明
這些資訊和出版物並非旨在提供,也不構成TradingView提供或認可的任何形式的財務、投資、交易或其他類型的建議或推薦。請閱讀使用條款以了解更多資訊。
免責聲明
這些資訊和出版物並非旨在提供,也不構成TradingView提供或認可的任何形式的財務、投資、交易或其他類型的建議或推薦。請閱讀使用條款以了解更多資訊。