PROTECTED SOURCE SCRIPT
Koma-Indikator v2
272,19
USD
+0,35
+0,13%
Apple, Inc. engages in the design, manufacture, and sale of smartphones, personal computers, tablets, wearables and accessories, and other varieties of related services. It operates through the following geographical segments: Americas, Europe, Greater China, Japan, and Rest of Asia Pacific. The Americas segment includes North and South America. The Europe segment consists of European countries, as well as India, the Middle East, and Africa. The Greater China segment comprises China, Hong Kong, and Taiwan. The Rest of Asia Pacific segment includes Australia and Asian countries. Its products and services include iPhone, Mac, iPad, AirPods, Apple TV, Apple Watch, Beats products, AppleCare, iCloud, digital content stores, streaming, and licensing services. The company was founded by Steven Paul Jobs, Ronald Gerald Wayne, and Stephen G. Wozniak in April 1976 and is headquartered in Cupertino, CA.
Es sind noch 14 Min. für die Script-Bearbeitung übrig
in dieser Minute
Koma-Indikator v2
Zu Favoriten hinzufügen
Auf Chart verwenden
0
0
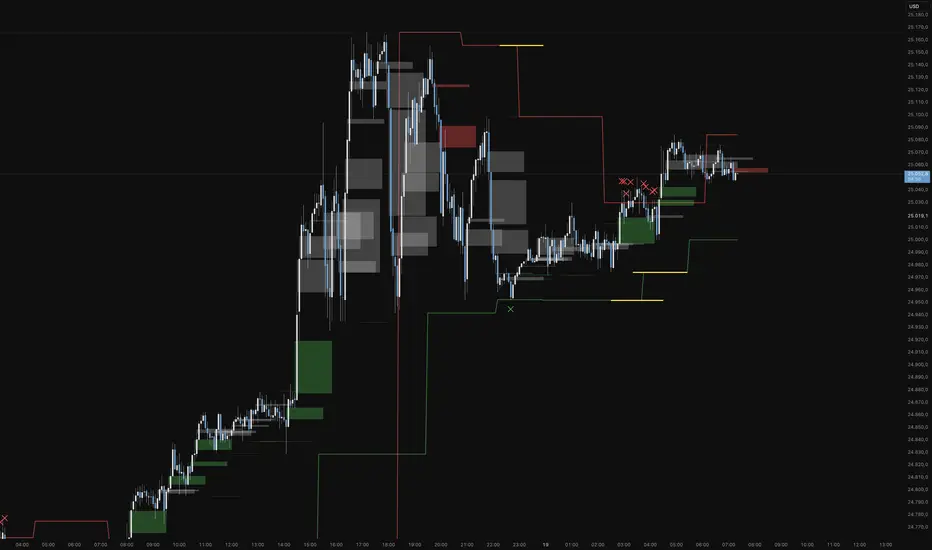
Functional Overview: Koma-Indikator V2
This indicator is a specialized analytical tool for Smart Money Concepts (SMC) trading. It is designed to automatically identify trend reversals, liquidity pools, and order flow shifts within the chart.
1. Liquidity Identification (BSL/SSL)
Major Range: The script automatically calculates significant highs and lows based on the "Major Lookback" period.
Buy-Side & Sell-Side Liquidity: These levels are plotted as red (BSL) and green (SSL) lines, serving as primary targets where the market often "hunts" for liquidity.
2. Sweep Detection (Liquidity Grabs)
The indicator detects when the price briefly exceeds a major high or low but closes back within the range.
Visuals: These potential reversal points are marked with an "X" icon above or below the candle (Sweep H/L).
3. Automated Market Structure Shifts (MSS)
The core logic tracks direction changes on two distinct levels:
Major MSS (Bold Yellow Line): Signals a significant trend reversal following a liquidity sweep. This is the primary confirmation for a new trend.
Minor MSS (Dotted Yellow Line): Highlights smaller structural breaks within a trend—ideal for aggressive "Sniper" entries on lower timeframes.
4. Dynamic Fair Value Gaps (FVG) & iFVGs
FVG Recognition: The indicator automatically draws boxes for bullish (green) and bearish (red) price imbalances.
Change in Delivery (iFVG): When a price candle closes through an existing FVG box, the box turns gray. This signals an Inverted FVG (iFVG), indicating that the order flow has officially shifted in the new direction.
5. Customization (Inputs)
Sensitivity: Users can adjust the lookback periods for both Trend (Major) and Entries (Minor) to suit different assets or timeframes.
Visual Hierarchy: All colors, line widths, and box lengths are configurable to maintain a clean and professional chart layout.
Trading Application:
By automating the "grunt work" of structural analysis, this tool allows you to focus on the trade execution:
Locate Liquidity: Identify BSL/SSL lines.
Watch for the Sweep: Look for the "X" marks.
Confirm the Shift: Wait for the yellow MSS lines.
Execute via Order Flow: Use the gray iFVG boxes as your Point of Interest (POI).
Geschütztes Skript
Dieses Script ist als Closed-Source veröffentlicht. Sie können es kostenlos und ohne Einschränkungen verwenden – erfahren Sie hier mehr.
Phantomas1
Haftungsausschluss
Die Informationen und Veröffentlichungen sind nicht als Finanz-, Anlage-, Handels- oder andere Arten von Ratschlägen oder Empfehlungen gedacht, die von TradingView bereitgestellt oder gebilligt werden, und stellen diese nicht dar. Lesen Sie mehr in den Nutzungsbedingungen.
Skript bearbeiten
Minimieren
Schließen
Koma-Indikator v2
Functional Overview: Koma-Indikator V2
This indicator is a specialized analytical tool for Smart Money Concepts (SMC) trading. It is designed to automatically identify trend reversals, liquidity pools, and order flow shifts within the chart.
1. Liquidity Identification (BSL/SSL)
Major Range: The script automatically calculates significant highs and lows based on the "Major Lookback" period.
Buy-Side & Sell-Side Liquidity: These levels are plotted as red (BSL) and green (SSL) lines, serving as primary targets where the market often "hunts" for liquidity.
2. Sweep Detection (Liquidity Grabs)
The indicator detects when the price briefly exceeds a major high or low but closes back within the range.
Visuals: These potential reversal points are marked with an "X" icon above or below the candle (Sweep H/L).
3. Automated Market Structure Shifts (MSS)
The core logic tracks direction changes on two distinct levels:
Major MSS (Bold Yellow Line): Signals a significant trend reversal following a liquidity sweep. This is the primary confirmation for a new trend.
Minor MSS (Dotted Yellow Line): Highlights smaller structural breaks within a trend—ideal for aggressive "Sniper" entries on lower timeframes.
4. Dynamic Fair Value Gaps (FVG) & iFVGs
FVG Recognition: The indicator automatically draws boxes for bullish (green) and bearish (red) price imbalances.
Change in Delivery (iFVG): When a price candle closes through an existing FVG box, the box turns gray. This signals an Inverted FVG (iFVG), indicating that the order flow has officially shifted in the new direction.
5. Customization (Inputs)
Sensitivity: Users can adjust the lookback periods for both Trend (Major) and Entries (Minor) to suit different assets or timeframes.
Visual Hierarchy: All colors, line widths, and box lengths are configurable to maintain a clean and professional chart layout.
Trading Application:
By automating the "grunt work" of structural analysis, this tool allows you to focus on the trade execution:
Locate Liquidity: Identify BSL/SSL lines.
Watch for the Sweep: Look for the "X" marks.
Confirm the Shift: Wait for the yellow MSS lines.
Execute via Order Flow: Use the gray iFVG boxes as your Point of Interest (POI).
Fortfahren
USD
+0,35
+0,13%
Apple, Inc. engages in the design, manufacture, and sale of smartphones, personal computers, tablets, wearables and accessories, and other varieties of related services. It operates through the following geographical segments: Americas, Europe, Greater China, Japan, and Rest of Asia Pacific. The Americas segment includes North and South America. The Europe segment consists of European countries, as well as India, the Middle East, and Africa. The Greater China segment comprises China, Hong Kong, and Taiwan. The Rest of Asia Pacific segment includes Australia and Asian countries. Its products and services include iPhone, Mac, iPad, AirPods, Apple TV, Apple Watch, Beats products, AppleCare, iCloud, digital content stores, streaming, and licensing services. The company was founded by Steven Paul Jobs, Ronald Gerald Wayne, and Stephen G. Wozniak in April 1976 and is headquartered in Cupertino, CA.
Es sind noch 14 Min. für die Script-Bearbeitung übrig
in dieser Minute
Koma-Indikator v2
Zu Favoriten hinzufügen
Auf Chart verwenden
0
0
Functional Overview: Koma-Indikator V2
This indicator is a specialized analytical tool for Smart Money Concepts (SMC) trading. It is designed to automatically identify trend reversals, liquidity pools, and order flow shifts within the chart.
1. Liquidity Identification (BSL/SSL)
Major Range: The script automatically calculates significant highs and lows based on the "Major Lookback" period.
Buy-Side & Sell-Side Liquidity: These levels are plotted as red (BSL) and green (SSL) lines, serving as primary targets where the market often "hunts" for liquidity.
2. Sweep Detection (Liquidity Grabs)
The indicator detects when the price briefly exceeds a major high or low but closes back within the range.
Visuals: These potential reversal points are marked with an "X" icon above or below the candle (Sweep H/L).
3. Automated Market Structure Shifts (MSS)
The core logic tracks direction changes on two distinct levels:
Major MSS (Bold Yellow Line): Signals a significant trend reversal following a liquidity sweep. This is the primary confirmation for a new trend.
Minor MSS (Dotted Yellow Line): Highlights smaller structural breaks within a trend—ideal for aggressive "Sniper" entries on lower timeframes.
4. Dynamic Fair Value Gaps (FVG) & iFVGs
FVG Recognition: The indicator automatically draws boxes for bullish (green) and bearish (red) price imbalances.
Change in Delivery (iFVG): When a price candle closes through an existing FVG box, the box turns gray. This signals an Inverted FVG (iFVG), indicating that the order flow has officially shifted in the new direction.
5. Customization (Inputs)
Sensitivity: Users can adjust the lookback periods for both Trend (Major) and Entries (Minor) to suit different assets or timeframes.
Visual Hierarchy: All colors, line widths, and box lengths are configurable to maintain a clean and professional chart layout.
Trading Application:
By automating the "grunt work" of structural analysis, this tool allows you to focus on the trade execution:
Locate Liquidity: Identify BSL/SSL lines.
Watch for the Sweep: Look for the "X" marks.
Confirm the Shift: Wait for the yellow MSS lines.
Execute via Order Flow: Use the gray iFVG boxes as your Point of Interest (POI).
Geschütztes Skript
Dieses Script ist als Closed-Source veröffentlicht. Sie können es kostenlos und ohne Einschränkungen verwenden – erfahren Sie hier mehr.
Phantomas1
Haftungsausschluss
Die Informationen und Veröffentlichungen sind nicht als Finanz-, Anlage-, Handels- oder andere Arten von Ratschlägen oder Empfehlungen gedacht, die von TradingView bereitgestellt oder gebilligt werden, und stellen diese nicht dar. Lesen Sie mehr in den Nutzungsbedingungen.
Skript bearbeiten
Minimieren
Schließen
Koma-Indikator v2
Functional Overview: Koma-Indikator V2
This indicator is a specialized analytical tool for Smart Money Concepts (SMC) trading. It is designed to automatically identify trend reversals, liquidity pools, and order flow shifts within the chart.
1. Liquidity Identification (BSL/SSL)
Major Range: The script automatically calculates significant highs and lows based on the "Major Lookback" period.
Buy-Side & Sell-Side Liquidity: These levels are plotted as red (BSL) and green (SSL) lines, serving as primary targets where the market often "hunts" for liquidity.
2. Sweep Detection (Liquidity Grabs)
The indicator detects when the price briefly exceeds a major high or low but closes back within the range.
Visuals: These potential reversal points are marked with an "X" icon above or below the candle (Sweep H/L).
3. Automated Market Structure Shifts (MSS)
The core logic tracks direction changes on two distinct levels:
Major MSS (Bold Yellow Line): Signals a significant trend reversal following a liquidity sweep. This is the primary confirmation for a new trend.
Minor MSS (Dotted Yellow Line): Highlights smaller structural breaks within a trend—ideal for aggressive "Sniper" entries on lower timeframes.
4. Dynamic Fair Value Gaps (FVG) & iFVGs
FVG Recognition: The indicator automatically draws boxes for bullish (green) and bearish (red) price imbalances.
Change in Delivery (iFVG): When a price candle closes through an existing FVG box, the box turns gray. This signals an Inverted FVG (iFVG), indicating that the order flow has officially shifted in the new direction.
5. Customization (Inputs)
Sensitivity: Users can adjust the lookback periods for both Trend (Major) and Entries (Minor) to suit different assets or timeframes.
Visual Hierarchy: All colors, line widths, and box lengths are configurable to maintain a clean and professional chart layout.
Trading Application:
By automating the "grunt work" of structural analysis, this tool allows you to focus on the trade execution:
Locate Liquidity: Identify BSL/SSL lines.
Watch for the Sweep: Look for the "X" marks.
Confirm the Shift: Wait for the yellow MSS lines.
Execute via Order Flow: Use the gray iFVG boxes as your Point of Interest (POI).
Fortfahren
受保護腳本
此腳本以閉源形式發佈。 不過,您可以自由使用,沒有任何限制 — 點擊此處了解更多。
免責聲明
這些資訊和出版物並非旨在提供,也不構成TradingView提供或認可的任何形式的財務、投資、交易或其他類型的建議或推薦。請閱讀使用條款以了解更多資訊。
受保護腳本
此腳本以閉源形式發佈。 不過,您可以自由使用,沒有任何限制 — 點擊此處了解更多。
免責聲明
這些資訊和出版物並非旨在提供,也不構成TradingView提供或認可的任何形式的財務、投資、交易或其他類型的建議或推薦。請閱讀使用條款以了解更多資訊。