INVITE-ONLY SCRIPT
DR/IDR Sessions with Standard Deviation (v1.5)
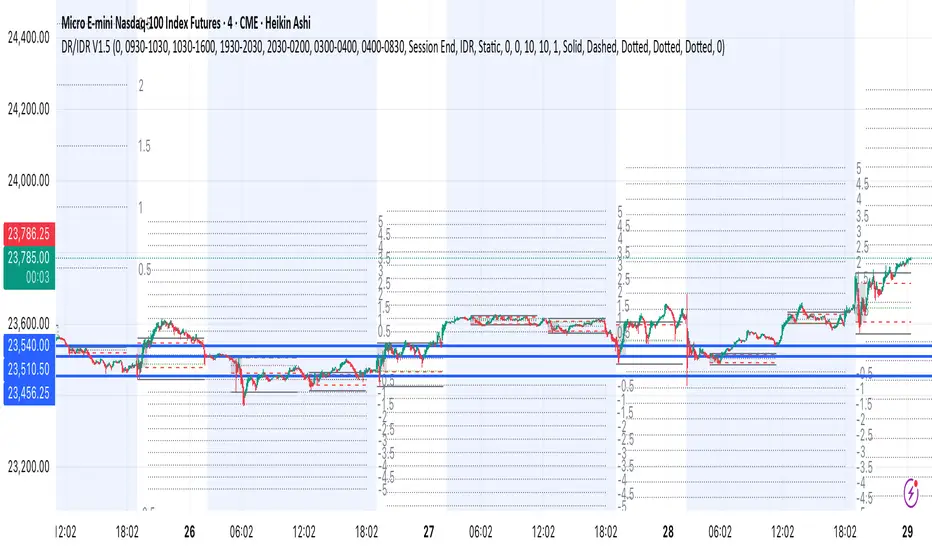
This indicator plots the Defining Range (DR) and Initial Defining Range (IDR) during Regular, After, and Overnight sessions. It automatically identifies the session highs, lows, and midpoints, then extends these levels into later trading hours for market structure analysis.
Key features:
📍 Session Detection: Automatically marks Regular (RDR), After-hours (ADR), and Overnight (ODR) ranges.
📈 DR & IDR Lines: High, Low, and optional Mid lines for both DR and IDR.
🟩 Opening Line: Plots the session’s opening price with customizable extension options.
🎨 Visual Boxes: Highlights the DR/IDR area with customizable up/down coloring (based on candle open/close).
➕ Standard Deviation Lines: Plots levels at multiples of 0.5 × IDR, either dynamically (following price) or statically (fixed number of levels).
⏳ Extend Options: Extend ranges to session end, ADR end, ODR end, or dynamically follow price.
⚙️ Highly Customizable: Colors, line styles, box shading, visibility history, and extension behavior.
Usage:
Traders use this indicator to analyze liquidity, session ranges, and potential breakout or mean-reversion zones. The DR/IDR concept is often used in ICT-style trading to identify accumulation ranges and expansion phases. Standard Deviation lines help in spotting overextensions and possible reversal levels.
僅限邀請腳本
只有經作者批准的使用者才能訪問此腳本。您需要申請並獲得使用權限。該權限通常在付款後授予。如欲了解更多詳情,請依照以下作者的說明操作,或直接聯絡Quantel_io。
除非您完全信任其作者並了解腳本的工作原理,否則TradingView不建議您付費或使用腳本。您也可以在我們的社群腳本中找到免費的開源替代方案。
作者的說明
To request access to this script, please send an email to support@quantel.io with your TradingView username and subscription details. Our team will review your request and grant access if eligible.
免責聲明
這些資訊和出版物並不意味著也不構成TradingView提供或認可的金融、投資、交易或其他類型的意見或建議。請在使用條款閱讀更多資訊。