OPEN-SOURCE SCRIPT
[TradersPost] Simple Trend Lines
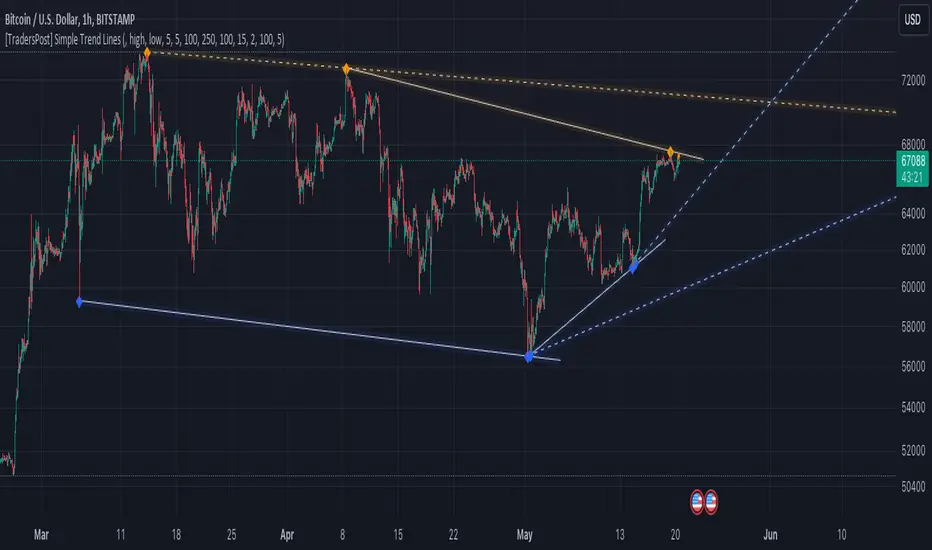
This script is designed to identify and visualize trends based on pivot highs and pivot lows over a user-defined timeframe on trading charts. It enhances trading strategy by dynamically plotting trend lines and adjusting to price changes, providing traders with real-time insights into potential breakout or breakdown points. This utility is crucial for those looking to refine entry and exit strategies based on technical trend analysis.
FEATURES
Dynamic Trend Lines: Automatically draws and updates trend lines based on pivot highs and pivot lows, helping traders to visualize current trends and potential reversal points.
Customizable Parameters: Offers extensive input options for users to define the number of bars to the left and right of pivots, the number of trends to track, and the sensitivity of the trend detection.
Trend Confirmation and Deletion: Includes features to confirm trends through multiple touchpoints and optionally remove broken trends from the display, keeping the chart uncluttered and focused on relevant information.
Design Flexibility: Users can customize the color and style of trend lines and labels, adapting the visual aspects of the script to their preferences or chart themes.
Performance Optimization: Utilizes efficient data structures and algorithms to manage memory and processing demands, ensuring that the script remains responsive even with extensive data.
DISCLAIMER
This script is provided for informational purposes only and does not guarantee profitability. It is still in the experimental phase and should be used as part of a comprehensive trading strategy that includes risk management and due diligence. Users should trade based on their own analysis and risk tolerance.
開源腳本
秉持TradingView一貫精神,這個腳本的創作者將其設為開源,以便交易者檢視並驗證其功能。向作者致敬!您可以免費使用此腳本,但請注意,重新發佈代碼需遵守我們的社群規範。
免責聲明
這些資訊和出版物並非旨在提供,也不構成TradingView提供或認可的任何形式的財務、投資、交易或其他類型的建議或推薦。請閱讀使用條款以了解更多資訊。
開源腳本
秉持TradingView一貫精神,這個腳本的創作者將其設為開源,以便交易者檢視並驗證其功能。向作者致敬!您可以免費使用此腳本,但請注意,重新發佈代碼需遵守我們的社群規範。
免責聲明
這些資訊和出版物並非旨在提供,也不構成TradingView提供或認可的任何形式的財務、投資、交易或其他類型的建議或推薦。請閱讀使用條款以了解更多資訊。