OPEN-SOURCE SCRIPT
Overextended vs 50DMA Detector
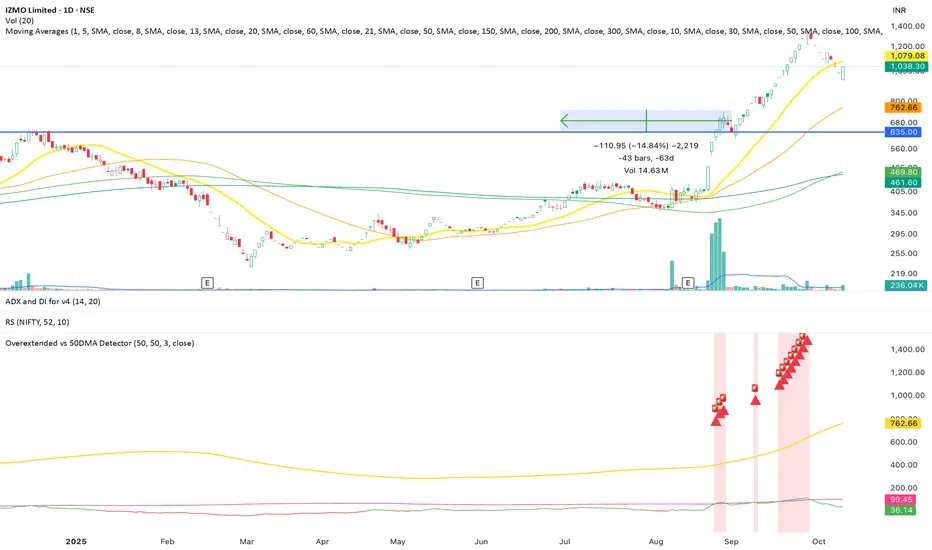
This indicator helps traders identify when a stock or asset becomes statistically overextended relative to its 50-day moving average (50DMA) — a key signal for potential pullbacks, consolidations, or profit-taking zones.
⸻
🔍 What It Does
• Calculates the 50-day simple moving average (SMA) of price.
• Computes the percentage gap between current price and the 50DMA.
• Measures the standard deviation of that percentage gap to assess volatility-adjusted extremes.
• Flags the stock as “Overextended” when:
• Price is more than 20% above the 50DMA, and
• The % gap is greater than 3× its historical standard deviation.
When these conditions are met, the script:
• Highlights the candle with a 🚨 red triangle on the chart.
• Shades the background to indicate potential overheating.
• Triggers an alert condition so traders can be notified in real time.
開源腳本
秉持TradingView一貫精神,這個腳本的創作者將其設為開源,以便交易者檢視並驗證其功能。向作者致敬!您可以免費使用此腳本,但請注意,重新發佈代碼需遵守我們的社群規範。
免責聲明
這些資訊和出版物並非旨在提供,也不構成TradingView提供或認可的任何形式的財務、投資、交易或其他類型的建議或推薦。請閱讀使用條款以了解更多資訊。
免責聲明
這些資訊和出版物並非旨在提供,也不構成TradingView提供或認可的任何形式的財務、投資、交易或其他類型的建議或推薦。請閱讀使用條款以了解更多資訊。