OPEN-SOURCE SCRIPT
Difference from Highest Price (Last N Candles)
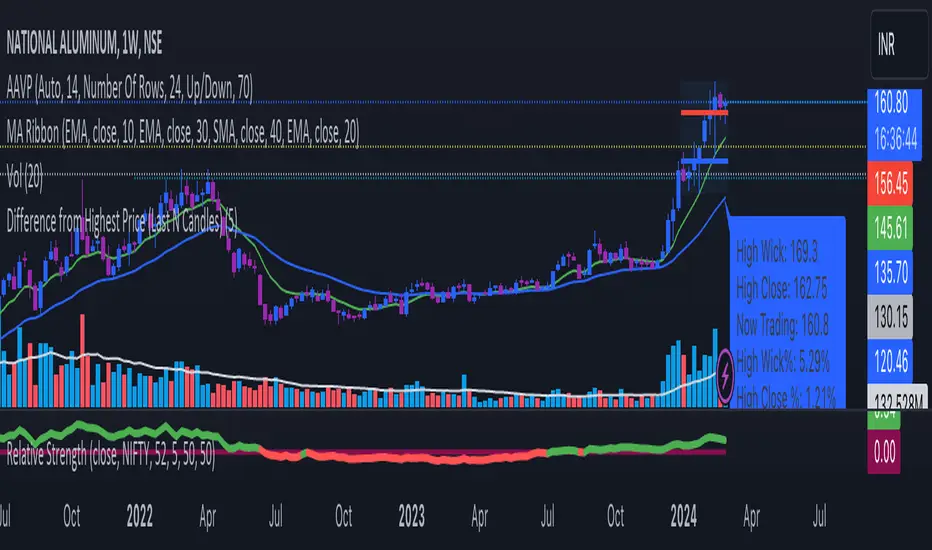
The output of this TradingView indicator is a label that appears below the latest candle on the chart. This label provides information about:
The highest high of the last N candles.
The highest close of the last N candles.
The current trading price.
The percentage difference between the highest high and the current trading price.
The percentage difference between the highest close and the current trading price.
The percentage change in price from the previous candle.
The N-day average percentage change.
This information is useful for traders to understand the relationship between the current price and recent price action, as well as to identify potential overbought or oversold conditions based on the comparison with recent highs and closes.
Here's a breakdown of what the code does:
It takes an input parameter for the number of days (or candles) to consider (input_days).
It calculates the highest high and highest close of the last N candles (highest_last_n_high and highest_last_n_close).
It calculates the difference between the close of the current candle and the close of the previous candle (diff), along with the percentage change.
It maintains an array of percentage changes of the last N days (percentage_changes), updating it with the latest percentage change.
It calculates the sum of percentage changes and the N-day average percentage change.
It calculates the difference between the highest high/highest close of the last N candles and the current trading price, along with their percentage differences.
Finally, it plots this information as a label below the candle for the latest bar.
開源腳本
本著TradingView的真正精神,此腳本的創建者將其開源,以便交易者可以查看和驗證其功能。向作者致敬!雖然您可以免費使用它,但請記住,重新發佈程式碼必須遵守我們的網站規則。
免責聲明
這些資訊和出版物並不意味著也不構成TradingView提供或認可的金融、投資、交易或其他類型的意見或建議。請在使用條款閱讀更多資訊。
開源腳本
本著TradingView的真正精神,此腳本的創建者將其開源,以便交易者可以查看和驗證其功能。向作者致敬!雖然您可以免費使用它,但請記住,重新發佈程式碼必須遵守我們的網站規則。
免責聲明
這些資訊和出版物並不意味著也不構成TradingView提供或認可的金融、投資、交易或其他類型的意見或建議。請在使用條款閱讀更多資訊。