OPEN-SOURCE SCRIPT
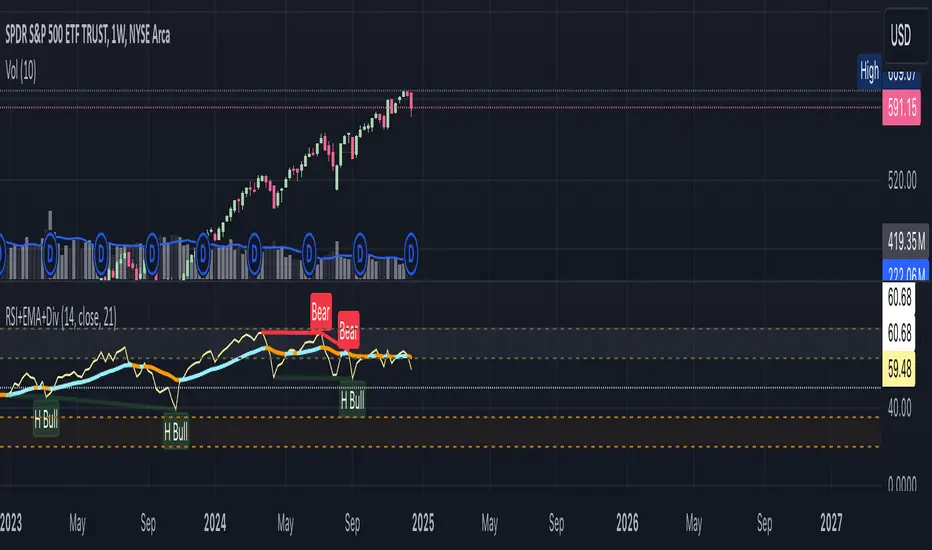
RSI+EMA+MZONES with Divergences

Features:
1. RSI Calculation:
2. EMA of RSI:
3. Bullish and Bearish Divergences:
4. Customizable Labels:
5. Alerts:
6. Fully Customizable:
How to Use:
1. RSI Calculation:
- Uses user-defined periods to calculate the RSI and visualize momentum shifts.
- Plots key RSI zones, including upper (overbought), lower (oversold), and middle levels.
2. EMA of RSI:
- Includes an Exponential Moving Average (EMA) of the RSI for trend smoothing and confirmation.
3. Bullish and Bearish Divergences:
- Detects Regular divergences (labeled as “Bull” and “Bear”) for classic signals.
- Identifies Hidden divergences (labeled as “H Bull” and “H Bear”) for potential trend continuation opportunities.
4. Customizable Labels:
- Displays divergence labels directly on the chart.
- Labels can be toggled on or off for better chart visibility.
5. Alerts:
- Predefined alerts for both regular and hidden divergences to notify users in real time.
6. Fully Customizable:
- Adjust RSI period, lookback settings, divergence ranges, and visibility preferences.
- Colors and styles are easily configurable to match your trading style.
How to Use:
- RSI Zones: Use RSI and its zones to identify overbought/oversold conditions.
- EMA: Look for crossovers or confluence with divergences for confirmation.
- Divergences: Monitor for “Bull,” “Bear,” “H Bull,” or “H Bear” labels to spot key reversal or continuation signals.
- Alerts: Set alerts to be notified of divergence opportunities without constant chart monitoring.
開源腳本
秉持TradingView一貫精神,這個腳本的創作者將其設為開源,以便交易者檢視並驗證其功能。向作者致敬!您可以免費使用此腳本,但請注意,重新發佈代碼需遵守我們的社群規範。
免責聲明
這些資訊和出版物並非旨在提供,也不構成TradingView提供或認可的任何形式的財務、投資、交易或其他類型的建議或推薦。請閱讀使用條款以了解更多資訊。
開源腳本
秉持TradingView一貫精神,這個腳本的創作者將其設為開源,以便交易者檢視並驗證其功能。向作者致敬!您可以免費使用此腳本,但請注意,重新發佈代碼需遵守我們的社群規範。
免責聲明
這些資訊和出版物並非旨在提供,也不構成TradingView提供或認可的任何形式的財務、投資、交易或其他類型的建議或推薦。請閱讀使用條款以了解更多資訊。