OPEN-SOURCE SCRIPT
[Teyo69] T1 Wyckoff Jump Across the Creek and Ice
📌 Overview
This indicator captures Wyckoff-style breakouts:
🧩 Features
📈 Super Trend
📉 EMA
🪨 [Super Slow] Support & Resistance
📊 Linear Regression
⚙️ How to Use
🎛️ Configuration
Indicator Leniency - Signal tolerance range after breakout
S&R Length - Pivot detection length for S/R method
Trend Method - Choose how trend is calculated
Volume SMA - Baseline for volume spike detection
Volume Length - Lookback for volume rising check
🧪 Signal Conditions
JAC Direction flips bullish + volume rising + spike
JAI Direction flips bearish + volume rising + spike
⚠️ Limitations
🔧 Advanced Tips
📝 Notes
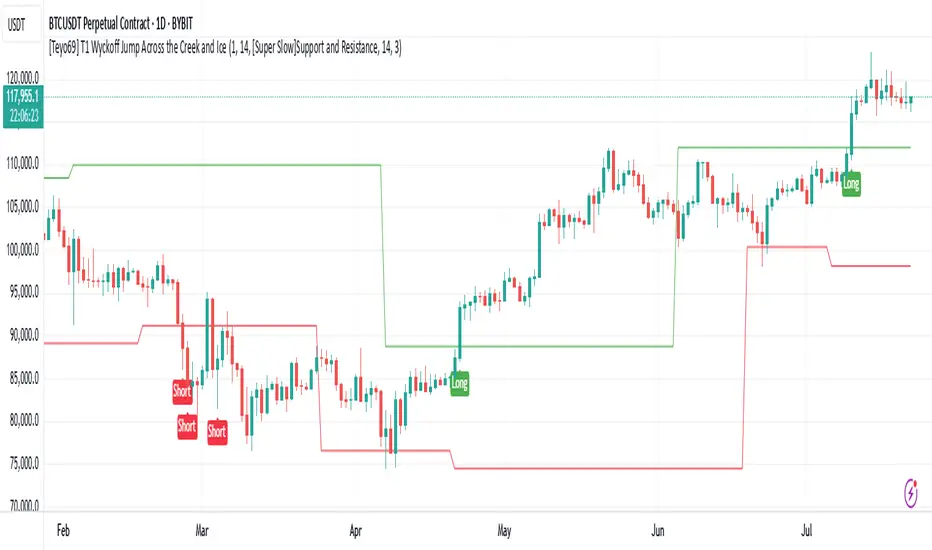
This indicator captures Wyckoff-style breakouts:
- JAC (Jump Across the Creek) for bullish structure breakouts
- JAI (Jump Across the Ice) for bearish breakdowns
- It blends support/resistance logic, volume behavior, and slope/momentum from selected trend-following methods.
🧩 Features
- Detects JAC (bullish breakout) and JAI (bearish breakdown) based on trend breakouts confirmed by volume.
- Supports multiple trend logic modes:
📈 Super Trend
📉 EMA
🪨 [Super Slow] Support & Resistance
📊 Linear Regression
- Dynamically plots Creek (resistance) and Ice (support)
- Incorporates volume spike and rising volume conditions for high-confidence signals
⚙️ How to Use
- Select your preferred trend method from the dropdown.
- Wait for:
- A breakout in direction (up or down)
- Rising volume and volume spike confirmation
- Follow "Long" (JAC) or "Short" (JAI) labels for potential entries.
🎛️ Configuration
Indicator Leniency - Signal tolerance range after breakout
S&R Length - Pivot detection length for S/R method
Trend Method - Choose how trend is calculated
Volume SMA - Baseline for volume spike detection
Volume Length - Lookback for volume rising check
🧪 Signal Conditions
JAC Direction flips bullish + volume rising + spike
JAI Direction flips bearish + volume rising + spike
⚠️ Limitations
- False signals possible during sideways/choppy markets.
- Volume behavior depends on exchange feed accuracy.
- S/R mode is slower but more stable; EMA & Linear Regression react faster but can whipsaw.
🔧 Advanced Tips
- Use this with Wyckoff Accumulation/Distribution zones for better context.
- Combine with RSI/OBV or higher timeframe trend filters.
- Adjust leniency_lookback if signals feel too early/late.
- If you're using Support and Resistance - Price action moves inside S & R it means that price is ranging.
📝 Notes
- Volume conditions must confirm breakout, not just direction shift.
- Built using native Pine Script switch and plotshape() for clarity.
- "Creek" and "Ice" lines are color-coded trend / Support and Resistance zones.
開源腳本
本著TradingView的真正精神,此腳本的創建者將其開源,以便交易者可以查看和驗證其功能。向作者致敬!雖然您可以免費使用它,但請記住,重新發佈程式碼必須遵守我們的網站規則。
免責聲明
這些資訊和出版物並不意味著也不構成TradingView提供或認可的金融、投資、交易或其他類型的意見或建議。請在使用條款閱讀更多資訊。
免責聲明
這些資訊和出版物並不意味著也不構成TradingView提供或認可的金融、投資、交易或其他類型的意見或建議。請在使用條款閱讀更多資訊。