OPEN-SOURCE SCRIPT
已更新 Bollinger Bands Weighted Alert System (BBWAS)
The idea of this indicator is very similar to my previous published script called BBAS (Bollinger Bands Alert System).
Just with little additions. In this case, we're using a Weighted Moving Average (ta.wma) instead of Simple Moving Average to calculate the basis line.
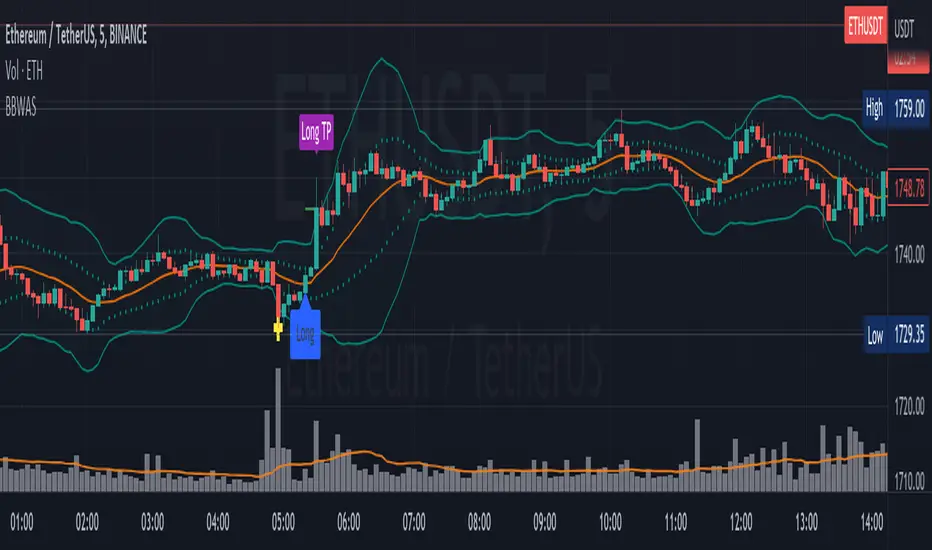
A breakout in trading refers to a situation where the price of a security or asset moves beyond a defined level of support or resistance, which is typically indicated by technical analysis tools like Bollinger Bands. Bollinger Bands consist of three lines: the upper band, the lower band, and the middle band (or basis). The upper and lower bands are set at a specified number of standard deviations away from the middle band, and they help to define the range within which the price of an asset is expected to fluctuate.
When the price of the asset moves beyond the upper or lower band, it is said to have "broken out" of the range. If the price closes below the lower band, it is considered a bearish breakout, and if it closes above the upper band, it is considered a bullish breakout.
Once a breakout occurs, traders may look for a confirmation signal before entering a trade. In this case, crossing the middle line (or basis) after a breakout may signal a potential trend reversal and a good opportunity to enter a long or short trade, depending on the direction of the breakout.
Dear traders, while we strive to provide you with the best trading tools and resources, we want to remind you to exercise caution and diligence in your investing decisions.
It is important to always do your own research and analysis before making any trades. Remember, the responsibility for your investments ultimately lies with you.
Happy trading!
Just with little additions. In this case, we're using a Weighted Moving Average (ta.wma) instead of Simple Moving Average to calculate the basis line.
A breakout in trading refers to a situation where the price of a security or asset moves beyond a defined level of support or resistance, which is typically indicated by technical analysis tools like Bollinger Bands. Bollinger Bands consist of three lines: the upper band, the lower band, and the middle band (or basis). The upper and lower bands are set at a specified number of standard deviations away from the middle band, and they help to define the range within which the price of an asset is expected to fluctuate.
When the price of the asset moves beyond the upper or lower band, it is said to have "broken out" of the range. If the price closes below the lower band, it is considered a bearish breakout, and if it closes above the upper band, it is considered a bullish breakout.
Once a breakout occurs, traders may look for a confirmation signal before entering a trade. In this case, crossing the middle line (or basis) after a breakout may signal a potential trend reversal and a good opportunity to enter a long or short trade, depending on the direction of the breakout.
Dear traders, while we strive to provide you with the best trading tools and resources, we want to remind you to exercise caution and diligence in your investing decisions.
It is important to always do your own research and analysis before making any trades. Remember, the responsibility for your investments ultimately lies with you.
Happy trading!
發行說明
- Adding RSI reversal alerts
發行說明
- Added strategy calculation: options to set potential take profit & stop-loss.
- Fix: looking previous period to check for breakout upside or downside
發行說明
- Adding ability to configure dynamic TPSL using Swing Low/High and custom Risk Reward Ratio (RRR). Hint: read the tooltips next to each parameter to understand how it works.
開源腳本
秉持TradingView一貫精神,這個腳本的創作者將其設為開源,以便交易者檢視並驗證其功能。向作者致敬!您可以免費使用此腳本,但請注意,重新發佈代碼需遵守我們的社群規範。
免責聲明
這些資訊和出版物並非旨在提供,也不構成TradingView提供或認可的任何形式的財務、投資、交易或其他類型的建議或推薦。請閱讀使用條款以了解更多資訊。
開源腳本
秉持TradingView一貫精神,這個腳本的創作者將其設為開源,以便交易者檢視並驗證其功能。向作者致敬!您可以免費使用此腳本,但請注意,重新發佈代碼需遵守我們的社群規範。
免責聲明
這些資訊和出版物並非旨在提供,也不構成TradingView提供或認可的任何形式的財務、投資、交易或其他類型的建議或推薦。請閱讀使用條款以了解更多資訊。