OPEN-SOURCE SCRIPT
Trendilo (OPEN-SOURCE)
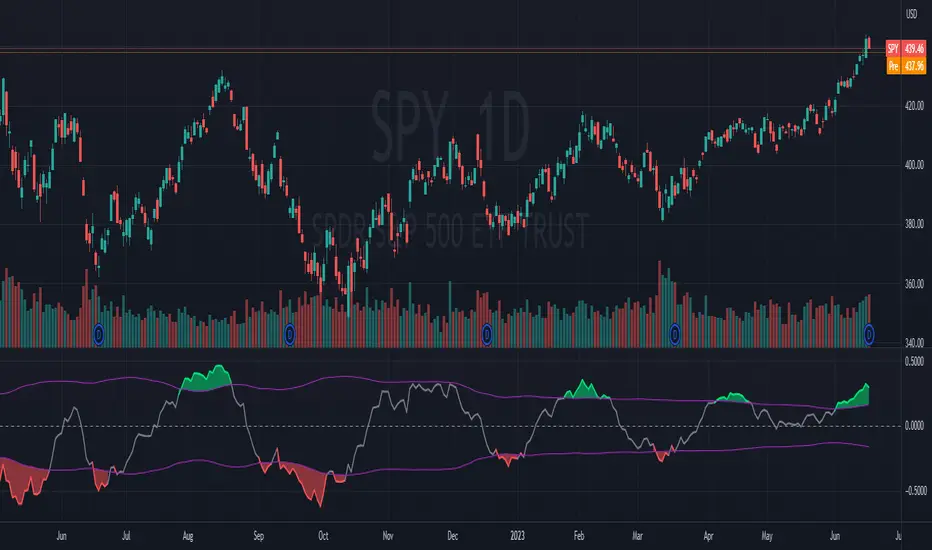
The provided code is a custom indicator called "Trendilo" in TradingView. It helps traders identify trends in price data. The indicator calculates the percentage change of the chosen price source and applies smoothing to it. Then, it calculates the Arnaud Legoux Moving Average (ALMA) of the smoothed percentage change. The ALMA is compared to a root mean square (RMS) band, which represents the expected range of the ALMA values. Based on this comparison, the indicator determines whether the trend is up, down, or sideways. The indicator line is plotted in a color corresponding to the trend direction. The indicator also provides the option to fill the area between the indicator line and the RMS band. Additionally, users can choose to color the bars of the chart based on the trend direction. Overall, the "Trendilo" indicator helps traders visually identify trends and potential reversals in the price data.
開源腳本
秉持TradingView一貫精神,這個腳本的創作者將其設為開源,以便交易者檢視並驗證其功能。向作者致敬!您可以免費使用此腳本,但請注意,重新發佈代碼需遵守我們的社群規範。
免責聲明
這些資訊和出版物並非旨在提供,也不構成TradingView提供或認可的任何形式的財務、投資、交易或其他類型的建議或推薦。請閱讀使用條款以了解更多資訊。
免責聲明
這些資訊和出版物並非旨在提供,也不構成TradingView提供或認可的任何形式的財務、投資、交易或其他類型的建議或推薦。請閱讀使用條款以了解更多資訊。