OPEN-SOURCE SCRIPT
IntraDay Pivot Lines, 30min IB
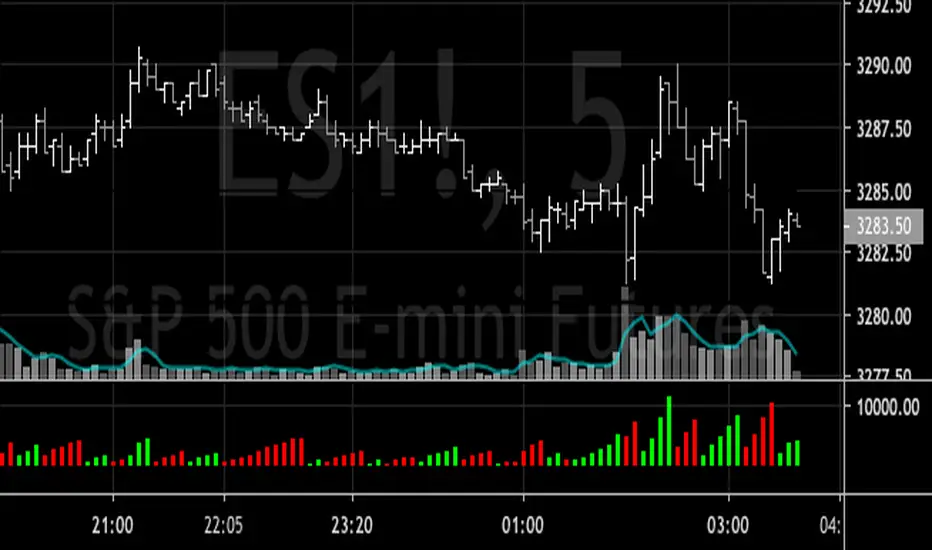
The script draws critical lines for IntraDay traders:
1) High/Low of the last Month - in Red/Green thick line
2) High/Low of the last Week - in Red/Green
3) High/Low of the first 30minute of the current trading day - in Yellow
4) High/Low of the first 5min of the trading day - in Grey
1) High/Low of the last Month - in Red/Green thick line
2) High/Low of the last Week - in Red/Green
3) High/Low of the first 30minute of the current trading day - in Yellow
4) High/Low of the first 5min of the trading day - in Grey
開源腳本
秉持TradingView一貫精神,這個腳本的創作者將其設為開源,以便交易者檢視並驗證其功能。向作者致敬!您可以免費使用此腳本,但請注意,重新發佈代碼需遵守我們的社群規範。
免責聲明
這些資訊和出版物並非旨在提供,也不構成TradingView提供或認可的任何形式的財務、投資、交易或其他類型的建議或推薦。請閱讀使用條款以了解更多資訊。
免責聲明
這些資訊和出版物並非旨在提供,也不構成TradingView提供或認可的任何形式的財務、投資、交易或其他類型的建議或推薦。請閱讀使用條款以了解更多資訊。