PROTECTED SOURCE SCRIPT
EarlBMACD
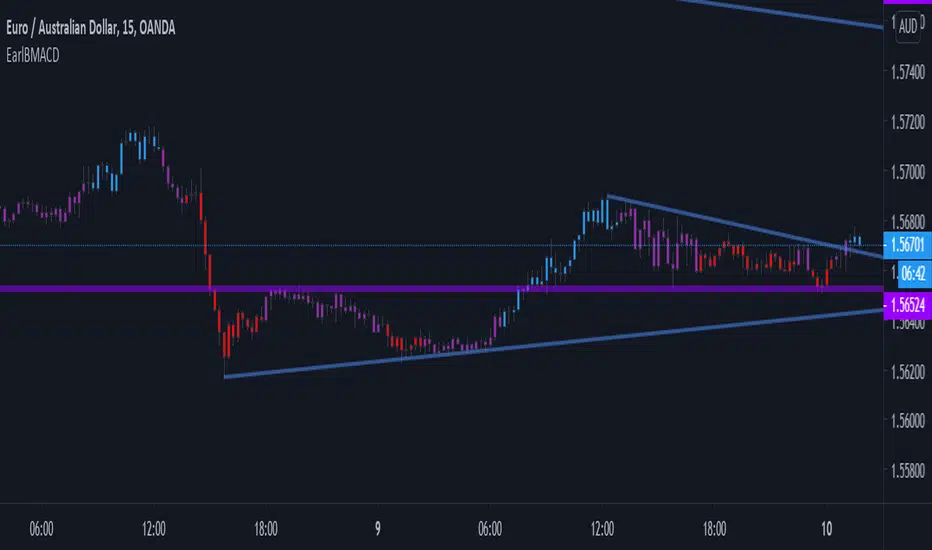
This indicator looks for a crossover of the MACD moving averages (12ema and 26ema) to generate a buy/sell signal and a crossover
of the MACD line (12ema minus 26ema) and MACD signal line (9ema of MACD line) in order to generate a completely seperate buy/sell signal.
The two buy/sell signals are combined into a hybrid buy/sell/hold indicator which looks for one, neither, or both to be "buys."
If both signals are buys (fast crossed above slow), a "buy" signal is given (green bar color)
If only one signal is a buy, a "hold" signal is given (yellow bar color)
If neither signal is a buy, a "sell" signal is given (red bar color) Note: MACD moving averages crossing over is the same thing as the MACD line crossing the zero level in the MACD indicator
It makes sense to have the MACD indicator loaded as a reference when using this but it isn't required.
The lines plotted on the chart are the 12ema and a signal line which is the MACD signal line shown relative to the 12ema rather than the MACD line
The 26ema is not plotted on the chart because the chart becomes cluttered,
plus the moving averages crossover is indicated with the MACD indicator.
受保護腳本
此腳本以閉源形式發佈。 不過,您可以自由使用,沒有任何限制 — 點擊此處了解更多。
免責聲明
這些資訊和出版物並非旨在提供,也不構成TradingView提供或認可的任何形式的財務、投資、交易或其他類型的建議或推薦。請閱讀使用條款以了解更多資訊。
受保護腳本
此腳本以閉源形式發佈。 不過,您可以自由使用,沒有任何限制 — 點擊此處了解更多。
免責聲明
這些資訊和出版物並非旨在提供,也不構成TradingView提供或認可的任何形式的財務、投資、交易或其他類型的建議或推薦。請閱讀使用條款以了解更多資訊。