OPEN-SOURCE SCRIPT
Stock-Index-Relative-Returns
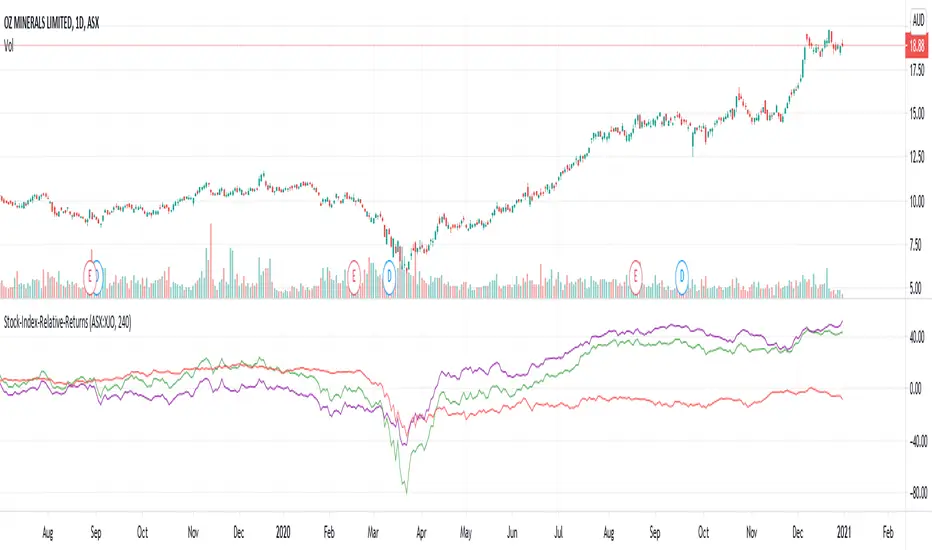
This is one of the entry conditions of Mark Minervini's trend template for entry conditions.
This indicator plots returns in comparison with index. (Change the index ticker in the input as per the stock in use)
Loopback period is the distance from which we are calculating returns.
Green line indicates returns of the stock
Red line indicates returns of the index
Purple line is the difference between both.
Mark Minervini's trend template expects stock_returns/index_returns to be at least 7 - which means at least 70% higher than index returns.
開源腳本
秉持TradingView一貫精神,這個腳本的創作者將其設為開源,以便交易者檢視並驗證其功能。向作者致敬!您可以免費使用此腳本,但請注意,重新發佈代碼需遵守我們的社群規範。
Trial - trendoscope.io/trial
Subscribe - trendoscope.io/pricing
Blog - docs.trendoscope.io
Subscribe - trendoscope.io/pricing
Blog - docs.trendoscope.io
免責聲明
這些資訊和出版物並非旨在提供,也不構成TradingView提供或認可的任何形式的財務、投資、交易或其他類型的建議或推薦。請閱讀使用條款以了解更多資訊。