OPEN-SOURCE SCRIPT
SMA Zone with Breakouts/Tests 1.0.
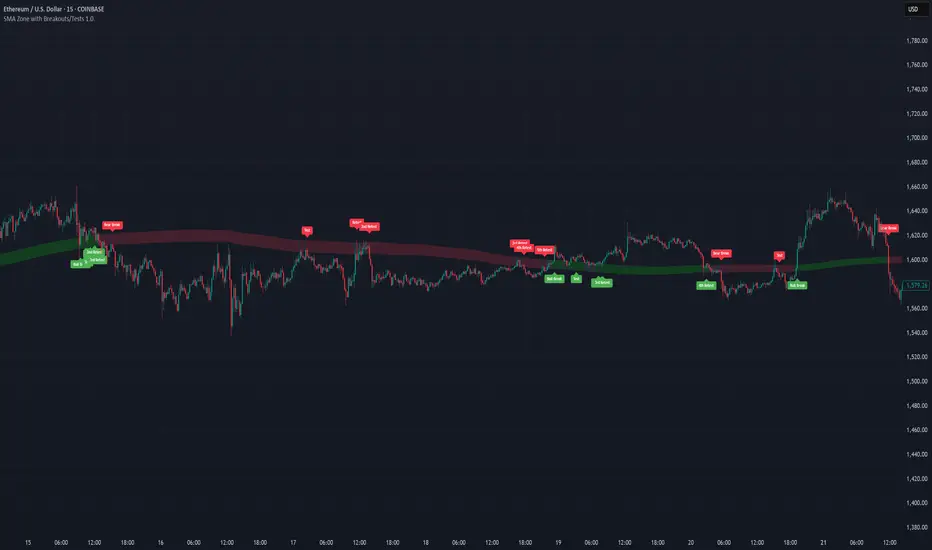
This indicator plots a dynamic “SMA Zone” between two simple moving averages (one applied to lows, one to highs) and highlights key interaction points with the zone:
Breakouts
Bull Break: price closes above the upper SMA
Bear Break: price closes below the lower SMA
Requires confirmation via either above-average volume or an unusually wide bar (spread > ATR) closing near its extreme
Tests & Retests
After a breakout, the first re-entry into the zone edge is labeled “Test,” subsequent re-entries are numbered “Retest,” “2nd Retest,” etc.
Zone Weakening: each additional Test/Retest signifies diminished zone strength—fewer reliable boundaries remain (Traditional S/R theory)
Alerts
Fires a unified “Zone Signal” alert on every Break, Test, and Retest (set condition to “Any alert() function call”).
Disclaimer:
This is not financial advice and should not be used as a standalone trading signal.
It’s designed to draw your attention to important price-zone interactions so you can manually tune in.
The logic can be further enhanced or combined with other indicators/algorithms as part of a more complex trading system.
開源腳本
秉持TradingView一貫精神,這個腳本的創作者將其設為開源,以便交易者檢視並驗證其功能。向作者致敬!您可以免費使用此腳本,但請注意,重新發佈代碼需遵守我們的社群規範。
免責聲明
這些資訊和出版物並非旨在提供,也不構成TradingView提供或認可的任何形式的財務、投資、交易或其他類型的建議或推薦。請閱讀使用條款以了解更多資訊。
免責聲明
這些資訊和出版物並非旨在提供,也不構成TradingView提供或認可的任何形式的財務、投資、交易或其他類型的建議或推薦。請閱讀使用條款以了解更多資訊。