OPEN-SOURCE SCRIPT
已更新 Daily Bubble Risk Adjustment

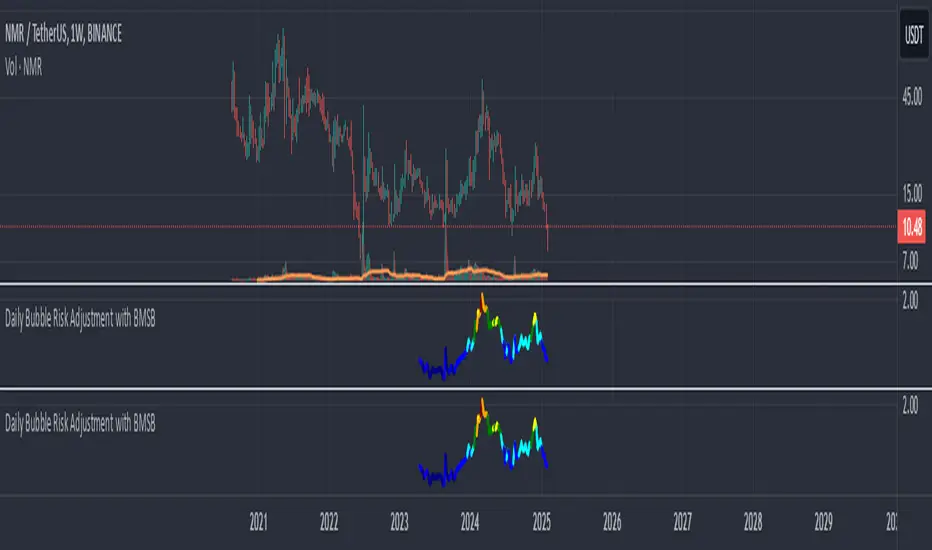
This script calculates the ratio of the asset's closing price to its 20-week moving average (20W MA) and visualizes it as a color-coded line chart. The script also includes a customizable moving average (default: 111-day MA) to help smooth the ratio trend.
It identifies overbought and oversold conditions relative to the 20W MA, making it a valuable tool for long-term trend analysis.
It identifies overbought and oversold conditions relative to the 20W MA, making it a valuable tool for long-term trend analysis.
發行說明
This script calculates the ratio of the asset's closing price to its 20-week moving average (20W MA) and visualizes it as a color-coded line chart. The script also includes a customizable moving average (default: 111-day MA) to help smooth the ratio trend.It identifies overbought and oversold conditions relative to the 20W MA, making it a valuable tool for long-term trend analysis.
發行說明
Key Updates:BMSB Implementation:
Added 20-SMA and 21-EMA calculations based on the ratio instead of price.
Introduced a shaded area between the two for better visualization.
Revised Color Assignments:
Adjusted the color gradient for different ratio ranges.
Improved color contrast for better readability.
Divergence Detection:
Implemented regular bullish and bearish divergences using pivot points.
Added labels and markers for easier trend identification.
發行說明
some adjustments for colors開源腳本
秉持TradingView一貫精神,這個腳本的創作者將其設為開源,以便交易者檢視並驗證其功能。向作者致敬!您可以免費使用此腳本,但請注意,重新發佈代碼需遵守我們的社群規範。
免責聲明
這些資訊和出版物並非旨在提供,也不構成TradingView提供或認可的任何形式的財務、投資、交易或其他類型的建議或推薦。請閱讀使用條款以了解更多資訊。
開源腳本
秉持TradingView一貫精神,這個腳本的創作者將其設為開源,以便交易者檢視並驗證其功能。向作者致敬!您可以免費使用此腳本,但請注意,重新發佈代碼需遵守我們的社群規範。
免責聲明
這些資訊和出版物並非旨在提供,也不構成TradingView提供或認可的任何形式的財務、投資、交易或其他類型的建議或推薦。請閱讀使用條款以了解更多資訊。