OPEN-SOURCE SCRIPT
ALMA & UT Bot Confluence Strategy
ALMA & UT Bot Confluence Strategy
This is a comprehensive trend-following and momentum strategy designed to identify high-probability trade setups by combining multiple layers of confirmation. It is built around an ALMA (Arnaud Legoux Moving Average) and a long-term EMA, and then enhances signal quality with the popular UT Bot indicator, a Volume Filter, and an adaptive hold mechanism.
The primary goal of this strategy is to filter out market noise, avoid low liquidity traps, and provide more robust and selective trading logic by adapting its timing to changing market volatility.
Key Features and How It Works
This strategy is not a simple crossover system. An entry signal is generated by the confluence of only a few conditions:
Underlying Trend and Signal Engine:
ALMA (Arnaud Legoux Moving Average): Provides a responsive, low-latency signal line for entries. EMA (Exponential Moving Average): A longer-term EMA acts as a primary trend filter, ensuring trades are executed only in line with the overall market trend.
Confirmation Layer:
UT Bot Confirmation: A trade is considered valid only when the UT Bot indicator provides a relevant buy or sell signal. This acts as a strong secondary confirmation, reducing false entries.
Advanced Filters for Signal Quality:
Volume Filter: This is an important safety mechanism that prevents trades from being executed in low-volume, illiquid markets where price action can be erratic and unreliable.
Momentum Filter (ADX and RSI): The strategy uses the ADX to check for sufficient market momentum and the RSI to ensure it doesn't enter overbought/oversold zones.
Volatility Filter (Bollinger Bands): This helps prevent entries when the price deviates too far from its average, preventing "buying at the top" or "selling at the bottom." Adaptive Timing (Dynamic Cool-Down):
Instead of a fixed waiting period between trades, this strategy uses a dynamic cooling-down period based on the ATR. It automatically waits longer during periods of high volatility (to prevent volatility) and becomes more responsive in calmer markets. How to Use This Strategy:
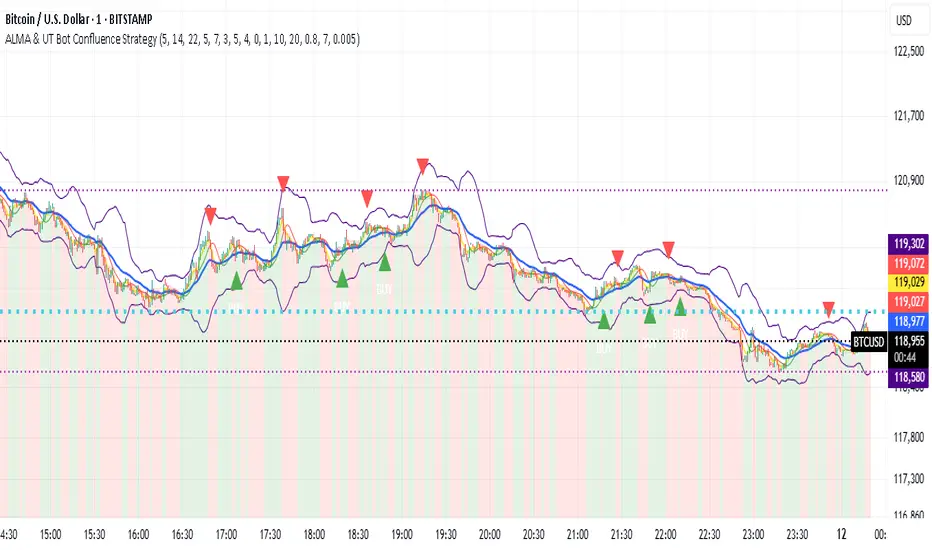
Long Entry (BUY): When all bullish conditions align, a green "BUY" triangle appears below the price.
Short Entry (SELL): When all bearish conditions align, a red "SELL" triangle appears above the price.
Trend Visualization: The chart background is color-coded according to UT Bot's trend direction (Green for an uptrend, Red for a downtrend), allowing for at-a-glance market analysis.
Double Exit Strategy Options
You have full control over how you exit trades:
Classic SL/TP: Use a standard Stop-Loss and Take-Profit order based on ATR (Average True Range) multipliers. UT Bot Trailing Stop (Recommended): A dynamic exit mechanism that follows the price allows your winning trades to catch up to larger trends while protecting your profits.
Disclaimer
This script is for educational purposes only and should not be construed as financial advice. Past performance is not indicative of future results. All trades involve risk. Before risking any capital, we strongly recommend extensively backtesting this strategy across your preferred assets and timeframes to understand its behavior and find settings that suit your personal trading style.
The author recommends using this strategy with Heikin-Ashi candlesticks. Using this method will significantly increase the strategy's trading success rate and profitability in backtests.
You should change the settings according to your preferred chart time range. You can find the best value for you by observing the value changes you make on the chart.
This is a comprehensive trend-following and momentum strategy designed to identify high-probability trade setups by combining multiple layers of confirmation. It is built around an ALMA (Arnaud Legoux Moving Average) and a long-term EMA, and then enhances signal quality with the popular UT Bot indicator, a Volume Filter, and an adaptive hold mechanism.
The primary goal of this strategy is to filter out market noise, avoid low liquidity traps, and provide more robust and selective trading logic by adapting its timing to changing market volatility.
Key Features and How It Works
This strategy is not a simple crossover system. An entry signal is generated by the confluence of only a few conditions:
Underlying Trend and Signal Engine:
ALMA (Arnaud Legoux Moving Average): Provides a responsive, low-latency signal line for entries. EMA (Exponential Moving Average): A longer-term EMA acts as a primary trend filter, ensuring trades are executed only in line with the overall market trend.
Confirmation Layer:
UT Bot Confirmation: A trade is considered valid only when the UT Bot indicator provides a relevant buy or sell signal. This acts as a strong secondary confirmation, reducing false entries.
Advanced Filters for Signal Quality:
Volume Filter: This is an important safety mechanism that prevents trades from being executed in low-volume, illiquid markets where price action can be erratic and unreliable.
Momentum Filter (ADX and RSI): The strategy uses the ADX to check for sufficient market momentum and the RSI to ensure it doesn't enter overbought/oversold zones.
Volatility Filter (Bollinger Bands): This helps prevent entries when the price deviates too far from its average, preventing "buying at the top" or "selling at the bottom." Adaptive Timing (Dynamic Cool-Down):
Instead of a fixed waiting period between trades, this strategy uses a dynamic cooling-down period based on the ATR. It automatically waits longer during periods of high volatility (to prevent volatility) and becomes more responsive in calmer markets. How to Use This Strategy:
Long Entry (BUY): When all bullish conditions align, a green "BUY" triangle appears below the price.
Short Entry (SELL): When all bearish conditions align, a red "SELL" triangle appears above the price.
Trend Visualization: The chart background is color-coded according to UT Bot's trend direction (Green for an uptrend, Red for a downtrend), allowing for at-a-glance market analysis.
Double Exit Strategy Options
You have full control over how you exit trades:
Classic SL/TP: Use a standard Stop-Loss and Take-Profit order based on ATR (Average True Range) multipliers. UT Bot Trailing Stop (Recommended): A dynamic exit mechanism that follows the price allows your winning trades to catch up to larger trends while protecting your profits.
Disclaimer
This script is for educational purposes only and should not be construed as financial advice. Past performance is not indicative of future results. All trades involve risk. Before risking any capital, we strongly recommend extensively backtesting this strategy across your preferred assets and timeframes to understand its behavior and find settings that suit your personal trading style.
The author recommends using this strategy with Heikin-Ashi candlesticks. Using this method will significantly increase the strategy's trading success rate and profitability in backtests.
You should change the settings according to your preferred chart time range. You can find the best value for you by observing the value changes you make on the chart.
開源腳本
本著TradingView的真正精神,此腳本的創建者將其開源,以便交易者可以查看和驗證其功能。向作者致敬!雖然您可以免費使用它,但請記住,重新發佈程式碼必須遵守我們的網站規則。
免責聲明
這些資訊和出版物並不意味著也不構成TradingView提供或認可的金融、投資、交易或其他類型的意見或建議。請在使用條款閱讀更多資訊。
免責聲明
這些資訊和出版物並不意味著也不構成TradingView提供或認可的金融、投資、交易或其他類型的意見或建議。請在使用條款閱讀更多資訊。