OPEN-SOURCE SCRIPT
Ruptura + EMAs + VWAP + Vela Impulsiva
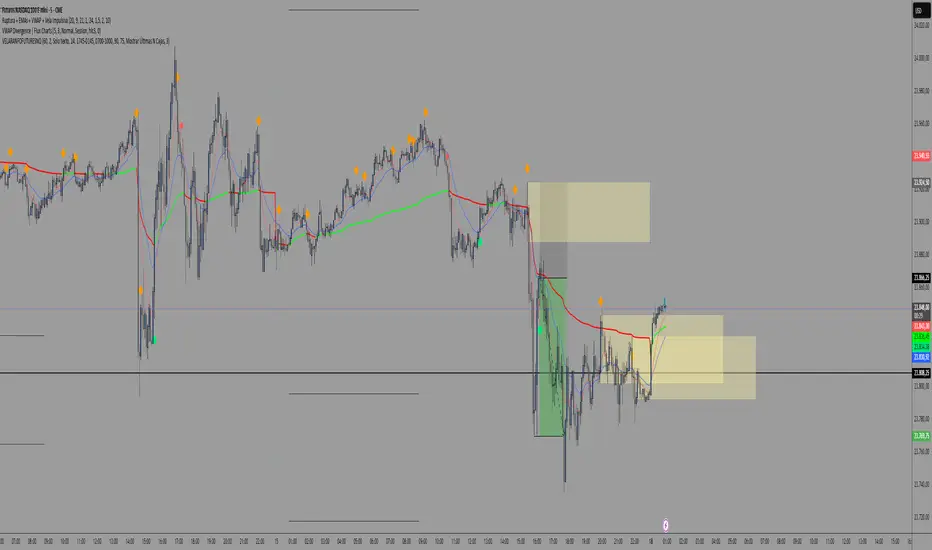
Indicator: Breakout + EMAs + VWAP + Impulsive Candle + TP/SL
This indicator is designed to identify breakout trading opportunities by combining price action, moving averages, volume-weighted price, and impulsive candles, with clearly defined Take Profit (TP) and Stop Loss (SL) levels.
⏱️ Timeframe Logic:
The 15-minute chart is used to define the price range.
Entries are made on the 2-minute chart when breakout conditions align with momentum confirmation.
📌 Key Components:
Range Definition:
Calculates a price range based on a customizable number of candles (rangeBars), typically from the 15-minute timeframe.
Displays a shaded box highlighting this range.
Trend Filters:
Uses a fast EMA (9) and a slow EMA (21) to determine short-term and medium-term trends.
Includes VWAP as a dynamic support/resistance and directional filter.
Only allows trades when both EMAs and price confirm alignment above (for long) or below (for short) the VWAP.
Impulsive Candle Detection:
Confirms breakouts using large-bodied candles that engulf the previous candle's range.
The candle must exceed a certain multiple of the average range (minRangeMult) to qualify.
Breakout Entry Conditions:
Long Setup: Price breaks above the range high, with EMAs and VWAP confirming bullish alignment, and confirmed by an impulsive candle.
Short Setup: Price breaks below the range low, with EMAs and VWAP aligned bearishly, confirmed by an impulsive candle.
Trade Management:
Automatically plots Take Profit and Stop Loss levels based on the size of the entry candle and a customizable TP multiplier.
Visual dashed lines indicate TP (green) and SL (red) zones.
Session Filter:
Entry signals are limited to a specific time window (e.g., 9:00 to 10:00 AM New York time), typically during the NY session open.
Visual Aids:
Background color highlights potential entry zones (green for long, red for short).
Icons mark confirmed impulsive candles and entry signals.
Range box is updated periodically to reflect the active breakout zone.
Script de código abierto
Siguiendo fielmente el espíritu de TradingView, el creador de este script lo ha publicado en código abierto, permitiendo que otros traders puedan revisar y verificar su funcionalidad. ¡Enhorabuena al autor! Puede utilizarlo de forma gratuita, pero tenga en cuenta que la publicación de este código está sujeta a nuestras Normas internas.
開源腳本
秉持TradingView一貫精神,這個腳本的創作者將其設為開源,以便交易者檢視並驗證其功能。向作者致敬!您可以免費使用此腳本,但請注意,重新發佈代碼需遵守我們的社群規範。
免責聲明
這些資訊和出版物並非旨在提供,也不構成TradingView提供或認可的任何形式的財務、投資、交易或其他類型的建議或推薦。請閱讀使用條款以了解更多資訊。
免責聲明
這些資訊和出版物並非旨在提供,也不構成TradingView提供或認可的任何形式的財務、投資、交易或其他類型的建議或推薦。請閱讀使用條款以了解更多資訊。