OPEN-SOURCE SCRIPT
已更新 ADMA
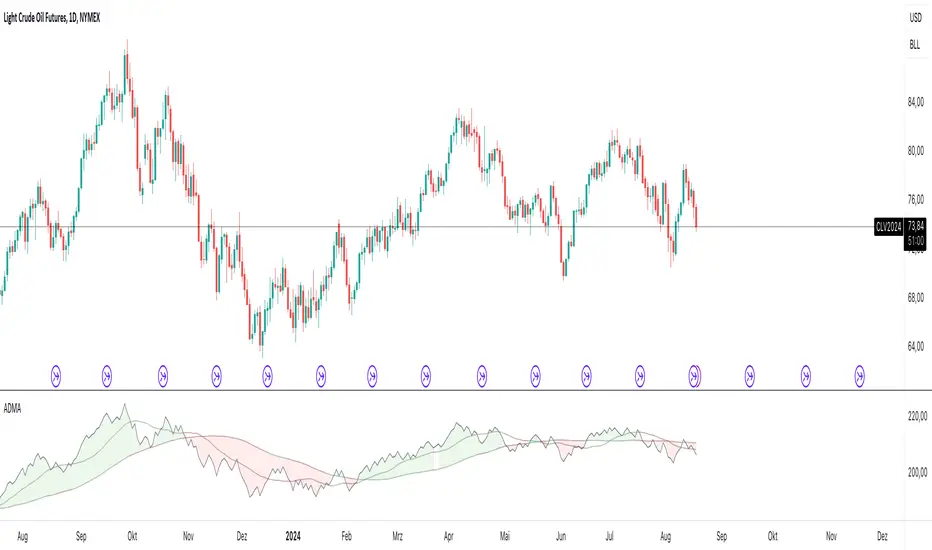
The ADMA indicator is a technical analysis tool designed to identify trends and potential reversal points in a financial market. The indicator is based on the cumulative difference between the closing price and the high and low points of a candle. Two moving averages (MAs) are used to smooth the trend dynamics and generate clear signals.
Calculation:
The indicator calculates the trend as the cumulative difference between the current closing price and the maximum (or minimum) value of the current and previous candle, depending on market development.
The ADMA indicator is particularly useful for recognizing market dynamics and making trading decisions based on them. By using double smoothing, false signals are reduced, and the signals generated by the indicator are clear and easy to interpret. It is a flexible tool that can be adapted to different trading strategies.
發行說明
Calculation Methodology:MaxCloseHigh and MinCloseLow:
MaxCloseHigh: Computes the higher value between the closing price (close) and the high price (high) of the current candle.
MinCloseLow: Determines the lower value between the closing price (close) and the low price (low) of the current candle.
Price Difference (priceDifference):
If the current closing price is higher than the previous closing price, the difference between the closing price and the low price (minCloseLow) is calculated.
If the current closing price is lower than the previous closing price, the difference between the closing price and the high price (maxCloseHigh) is calculated.
Cumulative Trend Calculation (cumulativeTrend):
The price difference (priceDifference) is aggregated over time to form a cumulative trend value, which represents the accumulated price movement.
Moving Average of the Trend:
SmoothedTrend: A Simple Moving Average (SMA) applied to the cumulative trend over a defined period (maLength) to smooth the trend and reduce noise.
SmoothedMidTrend: Another SMA applied to the cumulative trend over a shorter period (midMaLength) to allow for quicker response to changes in trend dynamics.
Applications and Use Cases:
Identifying Divergences:
The ADMA indicator excels at detecting divergences between price movements and the indicator itself. Divergences can serve as strong signals for potential trend reversals.
Bullish Divergence: When the price forms lower lows while the ADMA forms higher lows, suggesting a potential upward reversal.
Bearish Divergence: When the price makes higher highs while the ADMA forms lower highs, indicating a possible downward reversal.
How to Spot Divergences: Draw lines connecting two significant points on the price chart and compare them with corresponding points on the ADMA. Deviations between these lines indicate a divergence.
Assessing Market Conditions:
The smoothed line of the ADMA makes it easier to evaluate the current market environment.
Bullish Market: When the cumulativeTrend is above the smoothed trend, it signals a bullish market environment.
Bearish Market: When the cumulativeTrend is below the smoothed trend, it likely indicates a bearish market environment.
開源腳本
秉持TradingView一貫精神,這個腳本的創作者將其設為開源,以便交易者檢視並驗證其功能。向作者致敬!您可以免費使用此腳本,但請注意,重新發佈代碼需遵守我們的社群規範。
免責聲明
這些資訊和出版物並非旨在提供,也不構成TradingView提供或認可的任何形式的財務、投資、交易或其他類型的建議或推薦。請閱讀使用條款以了解更多資訊。
開源腳本
秉持TradingView一貫精神,這個腳本的創作者將其設為開源,以便交易者檢視並驗證其功能。向作者致敬!您可以免費使用此腳本,但請注意,重新發佈代碼需遵守我們的社群規範。
免責聲明
這些資訊和出版物並非旨在提供,也不構成TradingView提供或認可的任何形式的財務、投資、交易或其他類型的建議或推薦。請閱讀使用條款以了解更多資訊。