INVITE-ONLY SCRIPT
VolatWave‴ | Volatility Wave‴
What does it do?
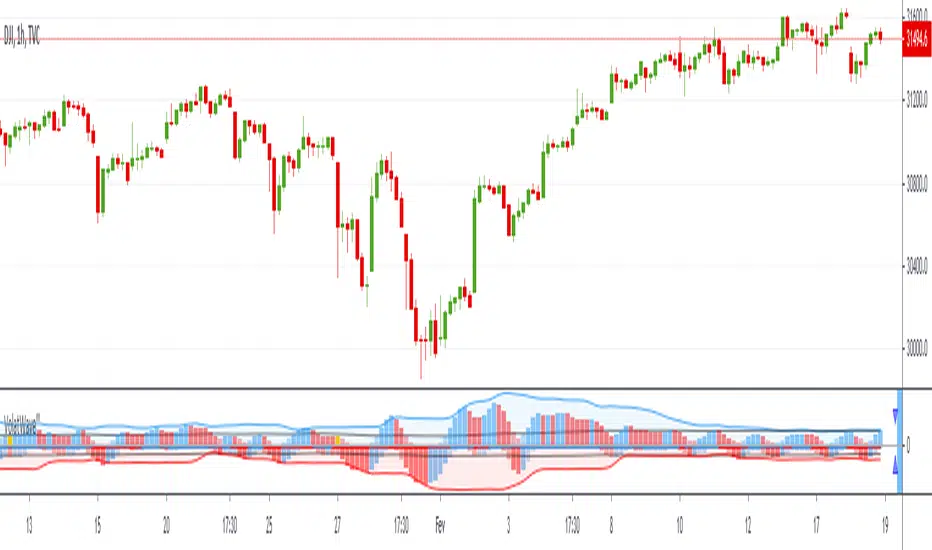
This indicator allows you to identify possible asset top and bottom reversals by having a prior Volatility acting among the price movement with a sequential positive (top reversal) or negative (bottom reversal) waves.
How does it work?
Everytime the wave starts showing a curved top movement (ascending price movment) or a curved bottom movement (descending price movment), it might be signing that a price reversal is on its way. It is possible to adjust the wave shape by increasing/decreasing its gradient value analysis, but it's so easy to use that most of the times no reconfiguration is needed, just add it and let it guide you.
Important to mention that the positive wave band, histogram bars and moving average line are calculate totally separete from the the negative wave.
What's my filling?
I'm still testing this indicator for only a week and so far still trying to understand its signs. I'm using it in conjunction with Volume Wave (VolWave) and Price Spread Wave (PSWave).
Indicator attributes:
- generally waves formation makes a symmetrical arc
- when the second half of a wave is elongated (compared to its first half), it suggests a lack of directional force of the current movement
- peak / bottom formation suggests reversal of the current movement
- smaller amplitude of a wave (compared to the previous wave) suggests loss of power, and vice-verse
- indicates divergence indication between peaks / bottoms
- when the volatility bar touches the volatility wave band, it suggests imminent reversal of the current movement
- wave band opening suggests movement increasing strength in that direction
- wavelengths (distance between two peaks / bottoms) tend to be similar
- subsequent wave rarely occurs
Technical information:
- the calculation of the positive movement is independent of the calculation of the positive movement
- the black line in the upper and lower zone is the average of the wave that is overcome, suggests strength in movement
- bands suggest delimitation of a wave's peak / bottom
To have access to this indicator, please DM me.
Don't contact me in the comment area.
僅限邀請腳本
僅作者批准的使用者才能訪問此腳本。您需要申請並獲得使用許可,通常需在付款後才能取得。更多詳情,請依照作者以下的指示操作,或直接聯絡MarceloTorres。
TradingView不建議在未完全信任作者並了解其運作方式的情況下購買或使用腳本。您也可以在我們的社群腳本中找到免費的開源替代方案。
作者的說明
To have access to this indicator, please DM me.
Don't contact me in the comment area.
TRADEWISER | Marcelo Torres
marcelo@tradewiser.pro
Vídeo-Análise completa diária no YouTube:
youtube.com/c/TradeWiserPro
Curso/AE
CursoAE.TradeWiser.pro
@TradeWiserPro
Telegram, Twitter, Facebook, LinkedIn, Instagram
marcelo@tradewiser.pro
Vídeo-Análise completa diária no YouTube:
youtube.com/c/TradeWiserPro
Curso/AE
CursoAE.TradeWiser.pro
@TradeWiserPro
Telegram, Twitter, Facebook, LinkedIn, Instagram
免責聲明
這些資訊和出版物並非旨在提供,也不構成TradingView提供或認可的任何形式的財務、投資、交易或其他類型的建議或推薦。請閱讀使用條款以了解更多資訊。