OPEN-SOURCE SCRIPT
已更新 Fisher Multi-Pack [DW]
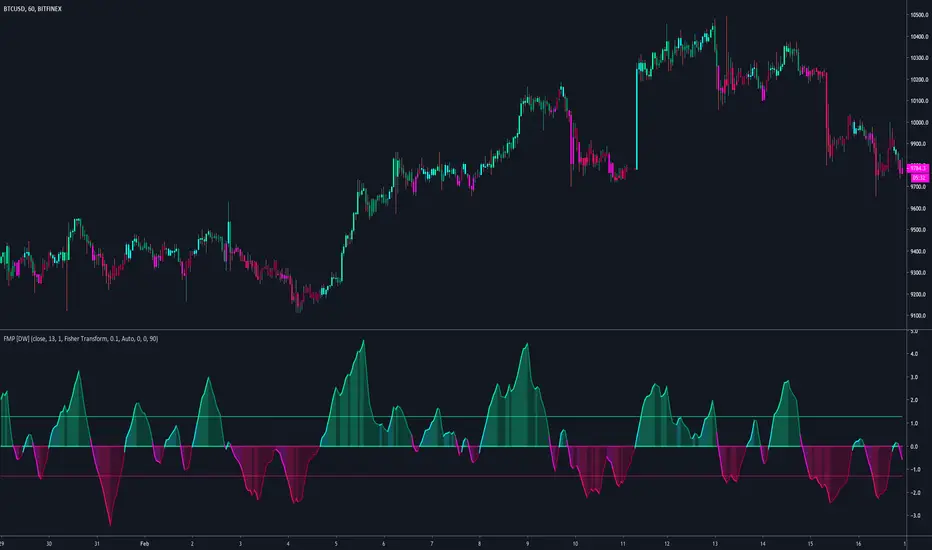
This is an experimental study designed to visualize price activity using John Ehlers Fisher Transform and Inverse Fisher Transform methods.
The Ehlers Fisher Transform is a variation of R. A. Fisher's Z transformation.
In this study, there are five oscillator types to choose from:
-Fisher Transform Indicator - A conversion of price's probability distribution to a Gaussian normal distribution with a smoother output
-Inverse Fisher Relative Strength Index - Converts the RSI's distribution to a bounded distribution between 1 and -1 with a smoother output
-Inverse Fisher Stochastic Oscillator - Converts the Stochastic's distribution to a bounded distribution between 1 and -1 with a smoother output
-Inverse Fisher Commodity Channel Index - Converts the CCI's distribution to a bounded distribution between 1 and -1 with a smoother output
-Inverse Fisher Blast Off Momentum - Converts the BOM's distribution to a bounded distribution between 1 and -1 with a smoother output
The study uses a modified set of Bollinger Bands applied to the chosen oscillator to determine trend and impulse activity, which are highlighted by the color scheme.
Custom bar colors are included.
發行說明
Updates:Cleaned up the script. Removed clutter.
Removed Inverse Fisher BOM from the oscillator types due to an excessive amount of false readings.
Thresholds are no longer Bollinger Bands. Instead, they are calculated using a cumulative average of the oscillator's deviation from 0.
Minor aesthetic changes.
發行說明
Updates:-> Reorganized script structure.
-> Main calculations are now expressed as functions.
-> Added custom threshold inputs.
-> Added an option to compress the oscillator around thresholds by a specified level of intensity. (Most useful with Fisher Transform oscillator type.)
-> Revamped color scheme.
開源腳本
秉持TradingView一貫精神,這個腳本的創作者將其設為開源,以便交易者檢視並驗證其功能。向作者致敬!您可以免費使用此腳本,但請注意,重新發佈代碼需遵守我們的社群規範。
For my full list of premium tools, check the blog:
wallanalytics.com/
Reach out on Telegram:
t.me/DonovanWall
wallanalytics.com/
Reach out on Telegram:
t.me/DonovanWall
免責聲明
這些資訊和出版物並非旨在提供,也不構成TradingView提供或認可的任何形式的財務、投資、交易或其他類型的建議或推薦。請閱讀使用條款以了解更多資訊。