PROTECTED SOURCE SCRIPT
已更新 CCI heatmap(15-170)
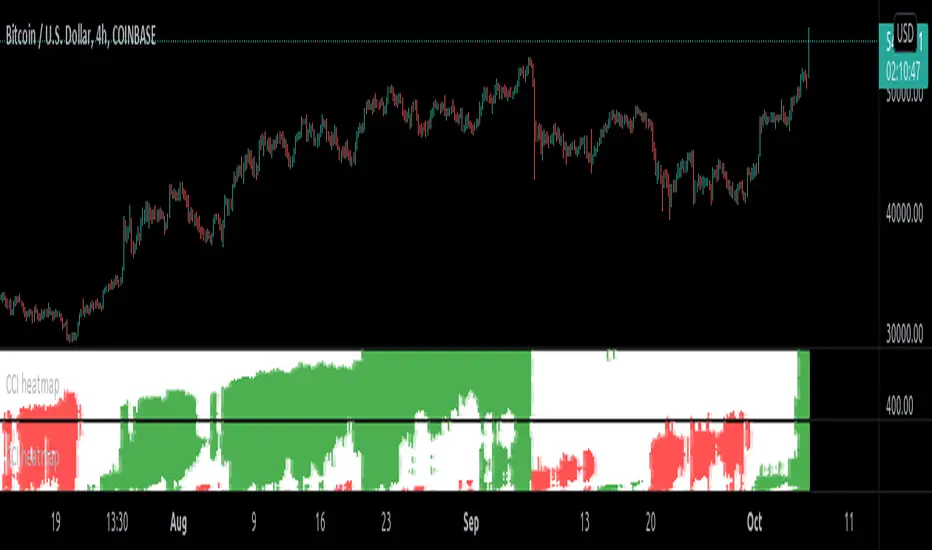
This is CCI (Commodity channel index) heatmap for the period lengths (15 to 170).
How to use :
1.) When overwhelming green appears, it means price is supposed to be trending up.
2.) When white appears, it means price is supposed to be neutral.
3.) When overwhelming red appears, it means price is supposed to be trending down.
Note: This indicator is supposed to be used with CCI heatmap(175-330) and CCI heatmap(335-490) aligned in increasing order of period lengths for higher resolution of period lengths. Otherwise use CCI heatmap(low resolution) indicator in which these 3 high resolution indicator is adjusted to a single indicator.
(Expect remaining indicator to be published to the public in mid of march 2021)
發行說明
Expanded the current script from input lengths (15-170) to now (20-330). Therefore no need of multiple instances/resolutions of same indicator.發行說明
This is advanced version of CCI ( Commodity channel index ) heatmap .
Add 2 instances of same indicator and put 'set2 lengths' above 'set1 lengths' (align in increasing order of period lengths) to get continuous pattern for larger picture otherwise you can always use just default set1 as well .
How to use :
1.) When overwhelming green appears, it means price is supposed to be trending up.
2.) When overwhelming red appears, it means price is supposed to be trending down.
3.) When white appears, it means price is currently neutral , at this point get ready and expect a breakout in either direction . In other words overwhelming white suggest asset is currently highly compressed(fuel in the tank) and expected to expand(burn the fuel) in either direction .
Did you know : CCI resembles Bollinger bands with 1.25 standard deviation . In CCI +100 and -100 resembles upper and lower band of bollinger band with 1.25 standard deviation (multi).
受保護腳本
此腳本以閉源形式發佈。 不過,您可以自由使用,沒有任何限制 — 點擊此處了解更多。
免責聲明
這些資訊和出版物並非旨在提供,也不構成TradingView提供或認可的任何形式的財務、投資、交易或其他類型的建議或推薦。請閱讀使用條款以了解更多資訊。
受保護腳本
此腳本以閉源形式發佈。 不過,您可以自由使用,沒有任何限制 — 點擊此處了解更多。
免責聲明
這些資訊和出版物並非旨在提供,也不構成TradingView提供或認可的任何形式的財務、投資、交易或其他類型的建議或推薦。請閱讀使用條款以了解更多資訊。