INVITE-ONLY SCRIPT
已更新 SMART indicator
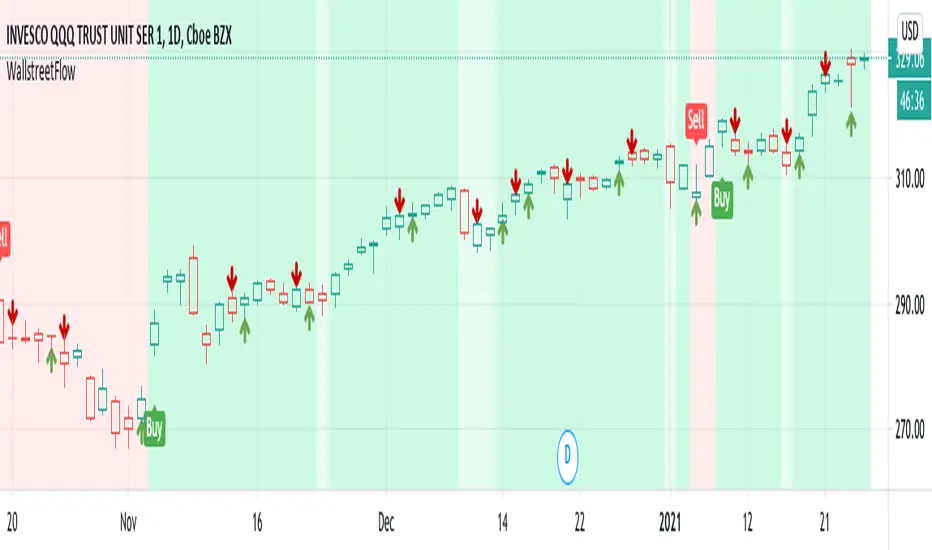
This script combines the usage of the SMA and ATR indicator in order to provide signals for opening and closing trades, either buy or sell signals. It uses SMA and ATR, both configurable by the users.
The trigger of Buy and Sell Signals are calculated through the SMA and ATR:
* Buy Signals: They are highlighted by a dark green background area.
* Sell Signals: They are highlighted by a dark red background area.
The trigger of Close Buy and Close Sell Signals are calculated through current price using SMA and ATR:
* Close Buy Signals: The fast SMA crosses under the close price and at the same time the trend is bullish. They are highlighted by a lighter green area.
* Close Sell Signals: The fast SMA crosses over the close price and at the same time the trend is bearish. They are highlighted by a lighter red area
Few important points about the indicator and the produced signals:
* This is not intended to be a strategy, but an indicator for analyzing the market conditions. It gives you the triggers depending on the real time analysis of the prices, but not being a proper strategy, pay attention about "fake signals" and add always a visual analysis to the provided signals
* Following this indicator, the trade positions should be opened only when background color appears GREEN. Either in this case, analyze the chart in order to see if the signals are "weak" ones, due to "waves" around the SMA . In these cases, you might wait for the next confirmation signals after the waves, when the trend will be better defined
* The close trade signals are provided in order to help to understand when you should close the buy or sell trades. Even in this case, always add a visual analysis to the signals, and pay attention to the support/resistance areas. Sometimes, you can have the close signals in correspondence to support/resistance areas: in these cases wait for the definition of the trend and eventually for the next close trade signals if they will be better defined
Final Notes
* Indicator will show Trend, Pullback, Market bounce and some support and resistance level.
發行說明
Changed the default value for length of period used to calculate for stop loss. Reduced it to make have a tight stop loss.發行說明
Changed value of default stop loss from 8 to 2 to increase more aggressive trading.發行說明
Adding a technical profit/loss points using stochastic rsi. Green arrow is a potential buy point with stop if close below previous candle or some percentage points. Red arrow on green background is profit booking point.發行說明
Adding one more condition to have a confirmation signal to BUY發行說明
Corrected script to take only the best method to make it easy for momentum buying. This will ease the way and take only stocks which are in momentum.發行說明
Changed the script to catch every direction, yellow color is the place to book half profits. Though the setup is not strong buy its worth buying and managing risk.發行說明
Reverting back to previous changes, though stop loss is big I think it's better from returns point.發行說明
Changing the default value發行說明
Making script generic to have only the visual effect by changing colors. Removing the stochastic overbought level indication.發行說明
Added BUY/SELL labels to work on dark themes僅限邀請腳本
僅作者批准的使用者才能訪問此腳本。您需要申請並獲得使用許可,通常需在付款後才能取得。更多詳情,請依照作者以下的指示操作,或直接聯絡WallStreetFlow。
TradingView不建議在未完全信任作者並了解其運作方式的情況下購買或使用腳本。您也可以在我們的社群腳本中找到免費的開源替代方案。
作者的說明
免責聲明
這些資訊和出版物並非旨在提供,也不構成TradingView提供或認可的任何形式的財務、投資、交易或其他類型的建議或推薦。請閱讀使用條款以了解更多資訊。
僅限邀請腳本
僅作者批准的使用者才能訪問此腳本。您需要申請並獲得使用許可,通常需在付款後才能取得。更多詳情,請依照作者以下的指示操作,或直接聯絡WallStreetFlow。
TradingView不建議在未完全信任作者並了解其運作方式的情況下購買或使用腳本。您也可以在我們的社群腳本中找到免費的開源替代方案。
作者的說明
免責聲明
這些資訊和出版物並非旨在提供,也不構成TradingView提供或認可的任何形式的財務、投資、交易或其他類型的建議或推薦。請閱讀使用條款以了解更多資訊。