OPEN-SOURCE SCRIPT
Harmony or Divergence Single Candle
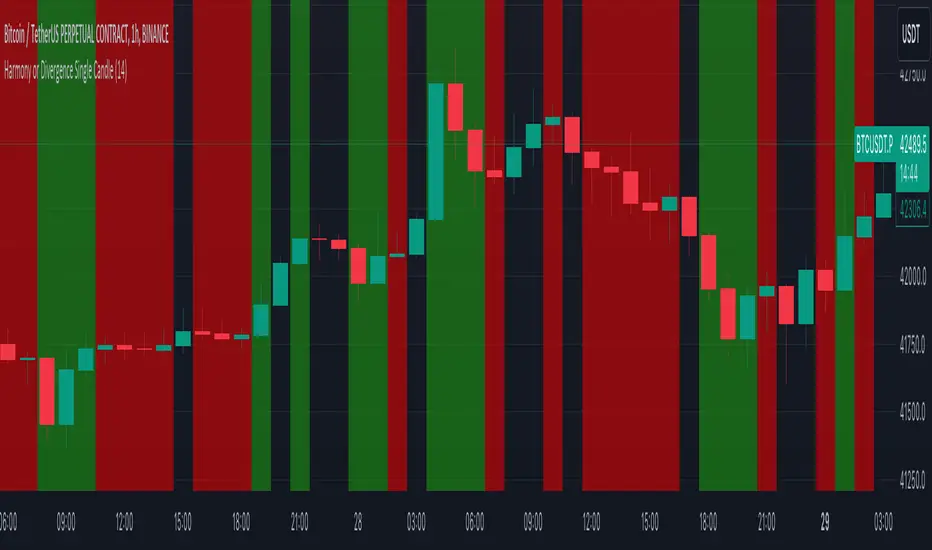
This script is designed for traders who seek to visually identify and analyze patterns of harmony and divergence in the price action of securities directly on their trading charts. The script provides a nuanced approach to understanding market sentiment and potential price movement directions by examining candle sizes and volumes over a specified lookback period.
What the Script Does:
The script overlays indicators on the price chart that highlight periods of harmony and divergence using background colors. These periods are determined based on comparisons between current candle sizes, candle volumes, and their respective simple moving averages (SMAs) over a user-defined lookback period.
How It Does It:
What Traders Can Do With the Script:
Traders can utilize this script to enhance their technical analysis by:
What the Script Does:
The script overlays indicators on the price chart that highlight periods of harmony and divergence using background colors. These periods are determined based on comparisons between current candle sizes, candle volumes, and their respective simple moving averages (SMAs) over a user-defined lookback period.
- Harmony: A state where the candle size and volume are either both above or below their respective averages, indicating a consensus or agreement in market direction.
- Divergence: A state where there's a mismatch, such as a larger candle size with lower volume or vice versa, suggesting uncertainty or potential reversal in market trends.
How It Does It:
- User Inputs: Traders can customize several parameters, including the lookback period for averages, whether to include wicks in candle size calculations, and preferences for displaying harmony and divergence indicators with specific colors.
- Calculations:
- The script calculates the simple moving average (SMA) of volume and candle sizes (with an option to consider the full candle range including wicks or just the body) over the specified lookback period.
- It then compares the current candle's size and volume against these averages to identify states of harmony or divergence. - Visualization:
- Based on the user's input, it colors the background of the chart to reflect identified patterns. Each state (harmony above or below average, divergence with higher volume or larger candle body) can be highlighted with different colors, providing immediate visual cues to the trader.
What Traders Can Do With the Script:
Traders can utilize this script to enhance their technical analysis by:
- Identifying Trend Consistency: Harmony indicators can signal strong trends where price action and volume confirm each other, possibly supporting continuation strategies.
- Spotting Potential Reversals: Divergence indicators may highlight potential exhaustion points or reversals, especially when price moves significantly without corresponding volume support.
- Customizing Analysis: By adjusting the lookback period, candle size consideration (body or including wicks), and visualization options, traders can tailor the analysis to fit their trading style and strategy.
開源腳本
秉持TradingView一貫精神,這個腳本的創作者將其設為開源,以便交易者檢視並驗證其功能。向作者致敬!您可以免費使用此腳本,但請注意,重新發佈代碼需遵守我們的社群規範。
免責聲明
這些資訊和出版物並非旨在提供,也不構成TradingView提供或認可的任何形式的財務、投資、交易或其他類型的建議或推薦。請閱讀使用條款以了解更多資訊。
開源腳本
秉持TradingView一貫精神,這個腳本的創作者將其設為開源,以便交易者檢視並驗證其功能。向作者致敬!您可以免費使用此腳本,但請注意,重新發佈代碼需遵守我們的社群規範。
免責聲明
這些資訊和出版物並非旨在提供,也不構成TradingView提供或認可的任何形式的財務、投資、交易或其他類型的建議或推薦。請閱讀使用條款以了解更多資訊。