OPEN-SOURCE SCRIPT
已更新 RSI For Loop
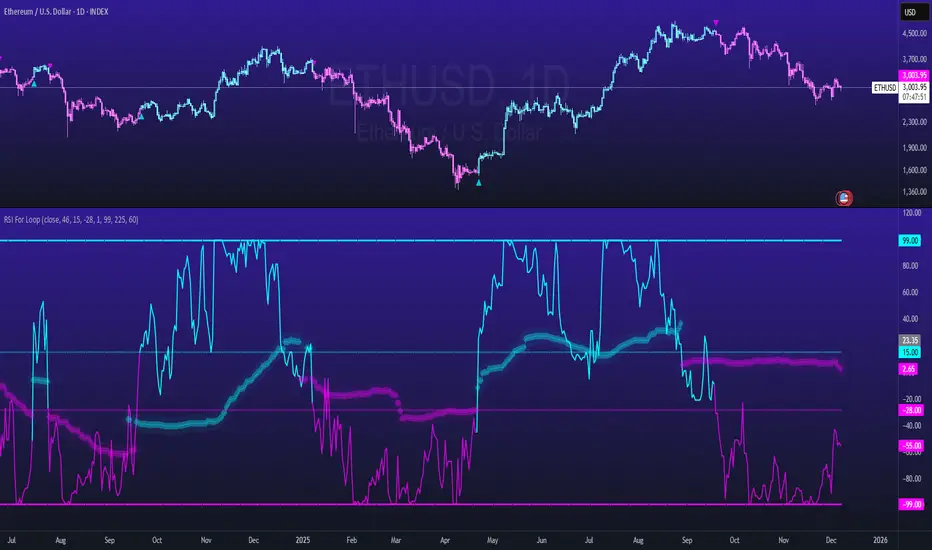
RSI For Loop – Enhanced RSI Dominance Oscillator
Original concept & innovation ©viResearch
Enhanced version with historical-comparison loop, median-based statistical strength bands, asymmetric thresholds, and visual upgrades
Core Concept (viResearch)
viResearch was the first to introduce the groundbreaking idea of replacing traditional fixed RSI levels with a loop-based scoring system that evaluates RSI behavior across a defined range, creating a dynamic, self-normalizing momentum score that dramatically reduces false signals in trending markets.
Key Enhancements in This Version
I kept the core brilliance of viResearch's loop concept but completely rewrote the scoring mechanism to make it even more powerful and adaptive:
1. Historical Dominance Comparison
The loop directly compares the current RSI value to the actual RSI values of the previous 1–99 bars (user-adjustable).
→ +1 for every past bar the current RSI beats
→ –1 for every past bar it loses to
This transforms the indicator into a true RSI Dominance / Percentile-Rank oscillator that instantly shows whether current momentum is stronger or weaker than nearly all recent history – perfectly adaptive to any market regime, volatility level, or asset.
2. Median + 3σ Statistical Strength Bands
Added a rolling median of the dominance score plus dynamic ±3σ bands calculated from the RSI score median standard deviation.
These bands identify genuinely extreme momentum phases (statistically rare events) that only occur during the strongest momentum or capitulation moves – giving high-conviction confirmation.
3. Visual & Practical Upgrades
- Clean bar/candle coloring
- On-chart triangle signals at trend changes
- Diamond stepline ±3σ bands
- Built-in alerts for both trend changes and extreme strength phases
- 9 professional color themes
How to Use It
Primary Trend Signals
- Green triangle + bullish bar color → New bullish momentum regime (score crosses above +15)
- Magenta triangle + bearish bar color → New bearish momentum regime (score crosses below –28)
These are some of the cleanest trend-change signals you will ever see – especially powerful on daily/weekly charts.
Extreme Strength Confirmation
Score breaks above the upper 3σ diamond line → Exceptional bullish strength/dominance (add to longs, strength behind the asset)
Score breaks below the lower 3σ diamond line → Exceptional bearish strength/dominance (capitulation or weakness)
These are rarer, very high-probability zones.
Zero-Line Context
Above zero = current RSI stronger than average recent history
Below zero = weaker than average recent history
Near zero = choppy/range-bound (stay out or mean-reversion trade)
Recommended Settings
RSI Length: 46
Loop range: 1 to 99 (~3–6 months on daily)
Long Threshold: +15
Short Threshold: –28
Median Length: 225
SD Length: 60
Works on all assets and timeframes. Absolutely deadly on daily/weekly for swing and position trading, and still excellent on 4H/30min for crypto/stocks.
This enhanced version honors viResearch's original genius while improving on it with true historical comparison and statistical extreme detection – delivering what is, in my opinion, one of the cleanest and most powerful momentum/trend indicators available on TradingView.
Backtests are based on past results and are not indicative of future performance.
發行說明
- name change of signal bool開源腳本
秉持TradingView一貫精神,這個腳本的創作者將其設為開源,以便交易者檢視並驗證其功能。向作者致敬!您可以免費使用此腳本,但請注意,重新發佈代碼需遵守我們的社群規範。
免責聲明
這些資訊和出版物並非旨在提供,也不構成TradingView提供或認可的任何形式的財務、投資、交易或其他類型的建議或推薦。請閱讀使用條款以了解更多資訊。
開源腳本
秉持TradingView一貫精神,這個腳本的創作者將其設為開源,以便交易者檢視並驗證其功能。向作者致敬!您可以免費使用此腳本,但請注意,重新發佈代碼需遵守我們的社群規範。
免責聲明
這些資訊和出版物並非旨在提供,也不構成TradingView提供或認可的任何形式的財務、投資、交易或其他類型的建議或推薦。請閱讀使用條款以了解更多資訊。