OPEN-SOURCE SCRIPT
已更新 Seasonality
This is my attempt to bring an open source Seasonality indicator to TradingView.
There are still outstanding issues I couldn't figure out, so I am hoping some more seasoned Pine Script coders can take the lead from here.
What is Seasonality: https://www.investopedia.com/terms/s/seasonality.asp
How to Use
Known Issues
Areas for Improvement
There are still outstanding issues I couldn't figure out, so I am hoping some more seasoned Pine Script coders can take the lead from here.
What is Seasonality: https://www.investopedia.com/terms/s/seasonality.asp
How to Use
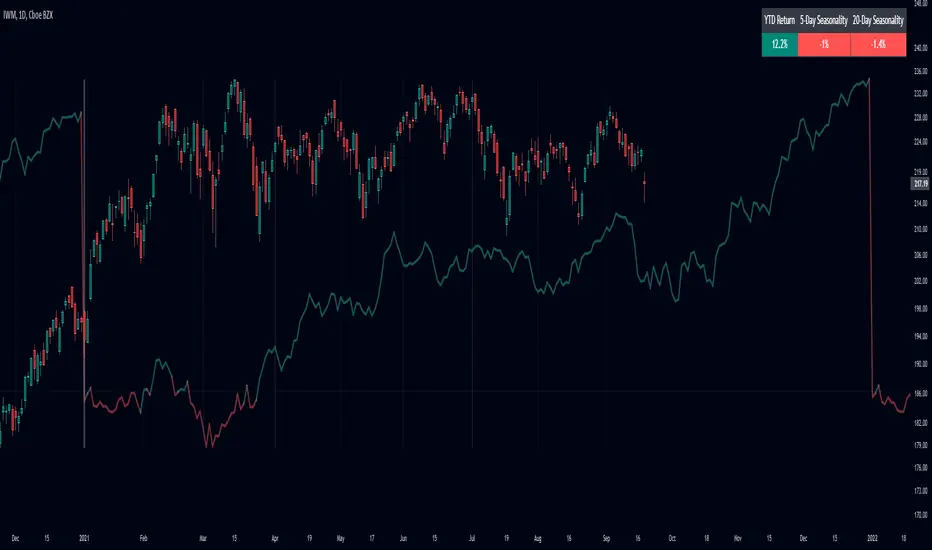
- The indicator plots the avg % change per bar for all complete years, up to 20 years back.
- It will only show in the daily resolution.
- For charts with more data, you need to scroll back a bit to get the line to display.
- Use Offset Adjust in the menu for charts that do not align perfectly to the start of the year.
- Use Smoothing in the menu to apply an EMA to the line.
- The panel shows YTD % gain, 5-day rolling seasonality, and 20-day rolling seasonality.
Known Issues
- Does not work for tickers with over 10,000 bars of data.
- Some tickers do not align correctly.
- Only works with tickers that have ~252 bars a year.
Areas for Improvement
- Figure out a way to use barssince() to get the precise amount of bars for each year. This will make the seasonality calculation and automatic offset more accurate.
- Have an option for calendar week, month, and year seasonality.
發行說明
Cleaned up the script.發行說明
Cleaned up the code some more so it is easier to read.開源腳本
秉持TradingView一貫精神,這個腳本的創作者將其設為開源,以便交易者檢視並驗證其功能。向作者致敬!您可以免費使用此腳本,但請注意,重新發佈代碼需遵守我們的社群規範。
免責聲明
這些資訊和出版物並非旨在提供,也不構成TradingView提供或認可的任何形式的財務、投資、交易或其他類型的建議或推薦。請閱讀使用條款以了解更多資訊。
開源腳本
秉持TradingView一貫精神,這個腳本的創作者將其設為開源,以便交易者檢視並驗證其功能。向作者致敬!您可以免費使用此腳本,但請注意,重新發佈代碼需遵守我們的社群規範。
免責聲明
這些資訊和出版物並非旨在提供,也不構成TradingView提供或認可的任何形式的財務、投資、交易或其他類型的建議或推薦。請閱讀使用條款以了解更多資訊。