OPEN-SOURCE SCRIPT
已更新 Relative Performance Spread
**Relative Performance Spread Indicator – Overview**
This indicator compares the **relative performance between two stocks** by normalizing their prices and calculating the **spread**, **area under the curve (AUC)**, or **normalized price ratio**.
### **How It Works**
* **Input**: Select a second stock (`ticker2`) and a moving average window.
* **Normalization**: Each stock is normalized by its own moving average → `norm = close / MA`.
* **Spread**: The difference `spread = norm1 - norm2` reflects which stock is outperforming.
* **AUC**: Cumulative spread over time shows prolonged dominance or underperformance.
* **Bounds**: Bollinger-style bands are drawn around the spread to assess deviation extremes.
### **Usage**
* **Plot Type Options**:
* `"Spread"`: Spot outperformance; crossing bands may signal rotation.
* `"AUC"`: Track long-term relative trend dominance.
* `"Normalized"`: Directly compare scaled price movements.
Use this tool for **pair trading**, **relative momentum**, or **rotation strategies**. It adapts well across assets with different price scales.
發行說明
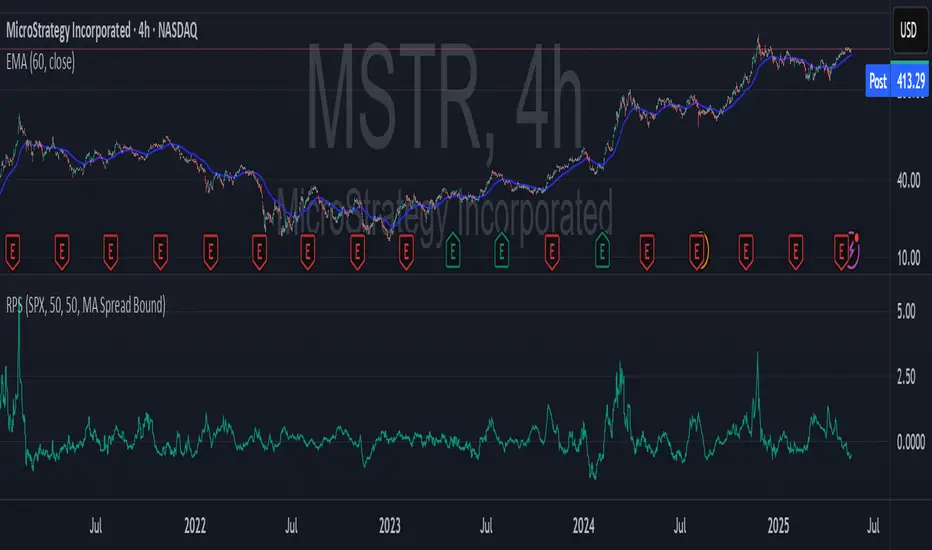
This indicator compares the performance of two stocks by analyzing their deviation from their own moving averages. It offers five plot modes:Spread: Shows the difference between the normalized prices of Stock 1 and Stock 2.
AUC (Area Under Curve): Cumulative spread over time, useful for detecting persistent out/underperformance.
Normalized: Plots each stock’s price relative to its moving average.
Z-Score Spread: Compares standardized deviations to highlight extreme divergences.
MA Spread Bound: Dynamically scales each stock’s deviation within upper/lower EMA bounds for robust comparison.
開源腳本
秉持TradingView一貫精神,這個腳本的創作者將其設為開源,以便交易者檢視並驗證其功能。向作者致敬!您可以免費使用此腳本,但請注意,重新發佈代碼需遵守我們的社群規範。
免責聲明
這些資訊和出版物並非旨在提供,也不構成TradingView提供或認可的任何形式的財務、投資、交易或其他類型的建議或推薦。請閱讀使用條款以了解更多資訊。
免責聲明
這些資訊和出版物並非旨在提供,也不構成TradingView提供或認可的任何形式的財務、投資、交易或其他類型的建議或推薦。請閱讀使用條款以了解更多資訊。