INVITE-ONLY SCRIPT
CandelaCharts - Block Concepts
📝 Overview
Block Concepts is a powerful toolkit inspired by ICT principles, designed to identify and highlight key areas of potential support and resistance. It includes the following block types:
The toolkit automatically detects and marks these blocks on the chart, enabling traders to quickly pinpoint critical zones for analysis and decision-making.
📦 Features
The Block Concepts toolkit offers a comprehensive set of features designed to enhance trading precision and decision-making. Key features include:
⚙️ Settings
⚡️ Showcase
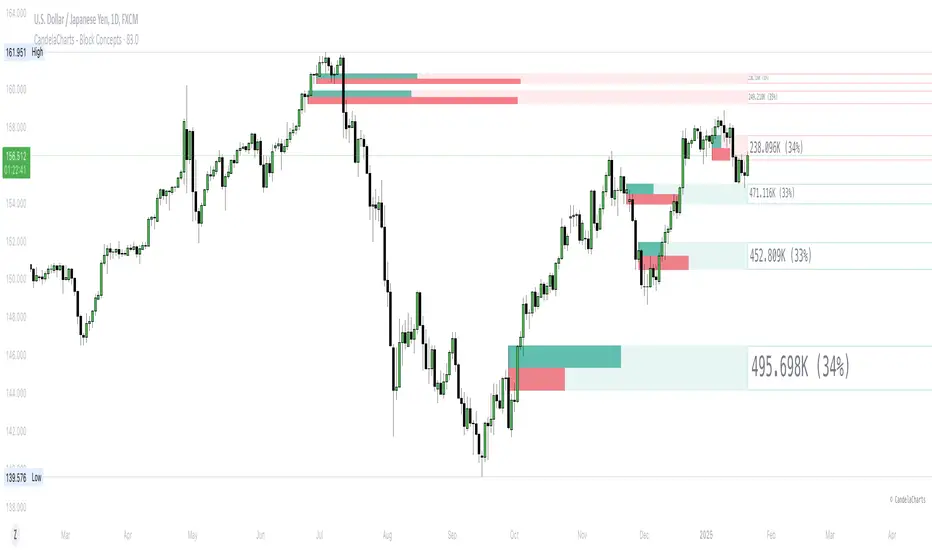
All blocks display their volume by default. Additionally, we provide the option to show plain boxes without volume information.
Order Blocks
Order block is the area in the price chart, where institutional traders execute a large number of orders in the market and the market shows a sudden strong move from that area.

Swing Order Blocks
Swing order blocks occur at significant swing highs or swing lows, often serving as critical levels for trend analysis and trade setups. These blocks are pivotal in determining the next price direction.

Breaker Blocks
Breaker blocks are zones where the price invalidates a previously strong support or resistance area, typically after a failed reversal attempt. These are formed when the price breaks through an order block in the opposite direction.

Mitigated

Plain

Consequent Encroachment

📒 Usage
When the trend is bearish and it approaches a demand zone where you would seek a reversal of price and at that area, the price shifts its structure to the buy-side.
Then you will be looking for the order block at the bottom of the impulse move which changed the market trend.

In a bearish trend, when price forms a bullish order block to attract buyers, you should wait for the price to hunt the stop losses of buyers and break below the bullish order block.
Once the price closes below the low of the bullish order block (sweeping buyers’ liquidity and shifting the market structure), you can mark the broken bullish order block as a bearish breaker block.
To enter a trade, you would wait for the price to retest the bearish breaker block area.
When executing a trade based on a bearish breaker block, your stop loss should be placed above the high of the breaker block.

Combine order blocks and breaker blocks to pinpoint high-probability confluence zones, refine entry and exit points, confirm trend reversals, and enhance overall trading accuracy.

The Block Concepts indicator offers a powerful toolkit for traders looking to navigate the complexities of market structure. By leveraging these concepts, traders can gain a deeper understanding of institutional trading footprints and potential areas of price reaction.
🚨 Alerts
The indicator provides the ability to set alerts for various significant market events related to its core features.
You can configure alerts for the following key events:
These alerts ensure you remain informed about crucial market conditions, enabling you to react promptly and refine your trading strategy with timely updates.
⚠️ Disclaimer
These tools are exclusively available on the TradingView platform.
Our charting tools are intended solely for informational and educational purposes and should not be regarded as financial, investment, or trading advice. They are not designed to predict market movements or offer specific recommendations. Users should be aware that past performance is not indicative of future results and should not rely on these tools for financial decisions. By using these charting tools, the purchaser agrees that the seller and creator hold no responsibility for any decisions made based on information provided by the tools. The purchaser assumes full responsibility and liability for any actions taken and their consequences, including potential financial losses or investment outcomes that may result from the use of these products.
By purchasing, the customer acknowledges and accepts that neither the seller nor the creator is liable for any undesired outcomes stemming from the development, sale, or use of these products. Additionally, the purchaser agrees to indemnify the seller from any liability. If invited through the Friends and Family Program, the purchaser understands that any provided discount code applies only to the initial purchase of Candela's subscription. The purchaser is responsible for canceling or requesting cancellation of their subscription if they choose not to continue at the full retail price. In the event the purchaser no longer wishes to use the products, they must unsubscribe from the membership service, if applicable.
We do not offer reimbursements, refunds, or chargebacks. Once these Terms are accepted at the time of purchase, no reimbursements, refunds, or chargebacks will be issued under any circumstances.
By continuing to use these charting tools, the user confirms their understanding and acceptance of these Terms as outlined in this disclaimer.
Block Concepts is a powerful toolkit inspired by ICT principles, designed to identify and highlight key areas of potential support and resistance. It includes the following block types:
- Order Blocks
- Swing Order Blocks
- Breaker Blocks
The toolkit automatically detects and marks these blocks on the chart, enabling traders to quickly pinpoint critical zones for analysis and decision-making.
📦 Features
The Block Concepts toolkit offers a comprehensive set of features designed to enhance trading precision and decision-making. Key features include:
- MTF
- Mitigation
- Consequent Encroachment
- Filtering
- Mode
- Positioning
- Hide Overlap
- Metrics
- Volume Activity
- Advanced Styling
⚙️ Settings
- Show: Controls whether Blocks are displayed on the chart.
- Show Last: Sets the number of Blocks you want to display.
- Length: Determines the length detection of each Block Type.
- Mitigation: Highlights when a Block has been touched, using a different color without marking it as invalid.
- Timeframe: Specifies the timeframe used to detect Block. This is MTF functionality.
- Mode: Sets the options available for Block detection.
- Filtering: Filter Blocks by CHoCH or BOS.
- Positioning: Position Blocks based on various options like Full, Middle, Accurate, and Precise.
- Buy/Sell activity: Display volume bullish/bearish activity for each Block.
- Show metrics: Display volume metrics on the Block.
- Show Mid-Line: Configures the midpoint line's width and style within the Block. (Consequent Encroachment - CE)
- Show Border: Defines the border width and line style of the Block.
- Hide Overlap: Removes overlapping Blocks from view.
- Grayscale: Display gray color on all Blocks no matter the bias.
⚡️ Showcase
All blocks display their volume by default. Additionally, we provide the option to show plain boxes without volume information.
Order Blocks
Order block is the area in the price chart, where institutional traders execute a large number of orders in the market and the market shows a sudden strong move from that area.
Swing Order Blocks
Swing order blocks occur at significant swing highs or swing lows, often serving as critical levels for trend analysis and trade setups. These blocks are pivotal in determining the next price direction.
Breaker Blocks
Breaker blocks are zones where the price invalidates a previously strong support or resistance area, typically after a failed reversal attempt. These are formed when the price breaks through an order block in the opposite direction.
Mitigated
Plain
Consequent Encroachment
📒 Usage
When the trend is bearish and it approaches a demand zone where you would seek a reversal of price and at that area, the price shifts its structure to the buy-side.
Then you will be looking for the order block at the bottom of the impulse move which changed the market trend.
In a bearish trend, when price forms a bullish order block to attract buyers, you should wait for the price to hunt the stop losses of buyers and break below the bullish order block.
Once the price closes below the low of the bullish order block (sweeping buyers’ liquidity and shifting the market structure), you can mark the broken bullish order block as a bearish breaker block.
To enter a trade, you would wait for the price to retest the bearish breaker block area.
When executing a trade based on a bearish breaker block, your stop loss should be placed above the high of the breaker block.
Combine order blocks and breaker blocks to pinpoint high-probability confluence zones, refine entry and exit points, confirm trend reversals, and enhance overall trading accuracy.
The Block Concepts indicator offers a powerful toolkit for traders looking to navigate the complexities of market structure. By leveraging these concepts, traders can gain a deeper understanding of institutional trading footprints and potential areas of price reaction.
🚨 Alerts
The indicator provides the ability to set alerts for various significant market events related to its core features.
You can configure alerts for the following key events:
- Order Block Formation (+B/-B)
- Breaker Block Formation (+B/-B)
- Swing Order Block Formation (+B/-B)
These alerts ensure you remain informed about crucial market conditions, enabling you to react promptly and refine your trading strategy with timely updates.
⚠️ Disclaimer
These tools are exclusively available on the TradingView platform.
Our charting tools are intended solely for informational and educational purposes and should not be regarded as financial, investment, or trading advice. They are not designed to predict market movements or offer specific recommendations. Users should be aware that past performance is not indicative of future results and should not rely on these tools for financial decisions. By using these charting tools, the purchaser agrees that the seller and creator hold no responsibility for any decisions made based on information provided by the tools. The purchaser assumes full responsibility and liability for any actions taken and their consequences, including potential financial losses or investment outcomes that may result from the use of these products.
By purchasing, the customer acknowledges and accepts that neither the seller nor the creator is liable for any undesired outcomes stemming from the development, sale, or use of these products. Additionally, the purchaser agrees to indemnify the seller from any liability. If invited through the Friends and Family Program, the purchaser understands that any provided discount code applies only to the initial purchase of Candela's subscription. The purchaser is responsible for canceling or requesting cancellation of their subscription if they choose not to continue at the full retail price. In the event the purchaser no longer wishes to use the products, they must unsubscribe from the membership service, if applicable.
We do not offer reimbursements, refunds, or chargebacks. Once these Terms are accepted at the time of purchase, no reimbursements, refunds, or chargebacks will be issued under any circumstances.
By continuing to use these charting tools, the user confirms their understanding and acceptance of these Terms as outlined in this disclaimer.
僅限邀請腳本
僅作者批准的使用者才能訪問此腳本。您需要申請並獲得使用許可,通常需在付款後才能取得。更多詳情,請依照作者以下的指示操作,或直接聯絡CandelaCharts。
請注意,此私人、僅限受邀使用者使用的腳本未經腳本審核員審核,其是否符合社群規範尚待確定。 TradingView不建議在未完全信任作者並了解其運作方式的情況下購買或使用腳本。您也可以在我們的社群腳本中找到免費的開源替代方案。
作者的說明
Explore all CandelaCharts indicators at: https://www.candelacharts.com/. Connect with our community on Discord: https://discord.gg/etGSTepqbu. All scripts and content provided by CandelaCharts are intended for informational and educational purposes only.
Get access to our exclusive tools: candelacharts.com
Join our community: discord.gg/etGSTepqbu
All content provided by CandelaCharts is for informational & educational purposes only.
Join our community: discord.gg/etGSTepqbu
All content provided by CandelaCharts is for informational & educational purposes only.
免責聲明
這些資訊和出版物並非旨在提供,也不構成TradingView提供或認可的任何形式的財務、投資、交易或其他類型的建議或推薦。請閱讀使用條款以了解更多資訊。