INVITE-ONLY SCRIPT
已更新 FibAlgo® - Perfect Entry Zone™
FibAlgo® - Perfect Entry Zone™
OVERVIEW
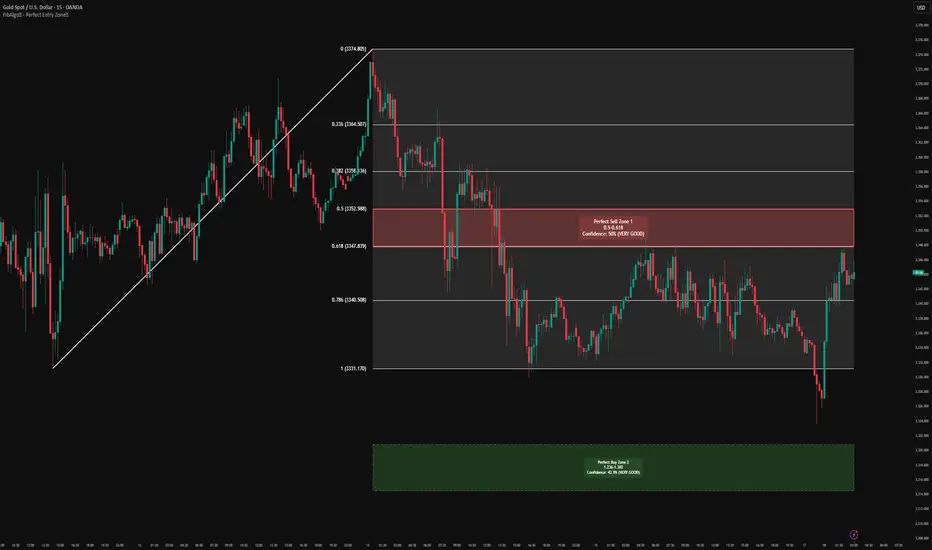
FibAlgo® - Perfect Entry Zone™ is an advanced technical analysis tool that dynamically detects and visualizes support and resistance levels in the market. Instead of static levels, it draws smart "Entry Zones" that change their color and function based on price action. The indicator's core concept is based on the principle that when a resistance level is broken, it becomes support (and vice versa). It automatically captures these "Support/Resistance Flip" moments. Its most powerful feature is the built-in "Adaptive System," or "The Brain," which analyzes historical data to find the Fibonacci levels with the highest historical accuracy and optimizes them for you.

CONCEPTS
Effective use of this indicator comes from understanding its three underlying core concepts.
1. The Adaptive Analysis Engine ("The Brain"): This is the indicator's most powerful feature. Instead of using a fixed period, it intelligently tests numerous past market peaks and troughs to find which Fibonacci range has historically produced the most accurate reversal signals. What makes this system special is its use of a weighted scoring system that prioritizes finding the "Zone 1" (the 0.0-1.0 Fibonacci range) with the highest confidence. In short, the algorithm is optimized to find the most reliable initial reversal areas for you.
2. Dynamic Zones and the S/R Flip (Support/Resistance Flip): The colored boxes you see on the chart represent the dynamic battle between support and resistance. Their colors and states change according to price action.
Uptrend Scenario: As a trend begins, a RED box appears as potential resistance. If the price breaks through this red box to the upside, the trend's strength is confirmed, and the indicator flips the box's color to GREEN. This means the old resistance has now become new support. This new green box is now a potential LONG entry area on a price retest.
Downtrend Scenario: As a trend begins, a GREEN box appears as potential support. If the price breaks down through this green box, the trend's strength is validated, and the indicator flips the box's color to RED. This shows that the old support has now become new resistance. This new red box is now a potential SHORT entry area on a price retest.
3. Confidence Percentage (% Confidence): This percentage, displayed on each box, is a data-driven score that shows the historical significance of that price zone. It answers the question: "In the past, how often did the market react to this specific price area?" A higher percentage suggests the zone is more significant and noteworthy.

FEATURES
Intelligent Adaptive System ("The Brain"): A smart engine that automatically finds and optimizes the most suitable Fibonacci analysis period for the market.
Dynamic Support/Resistance Flip Zones: Visually intuitive entry zones that automatically change function and color (from red to green or green to red) based on price breakouts.
Data-Driven Confidence Score: A confidence rating that displays the historical importance and success rate of each zone as a percentage, aiding in decision-making.
Automatic Fibonacci Drawing: Automatically detects significant peaks and troughs (pivots) in the market and draws the relevant Fibonacci structure for you.
Comprehensive Visual Customization: The ability to adjust many visual elements to your personal preference, including trend lines, level lines, colors, label positions, and font sizes.
Built-in User Guide: A detailed user manual, viewable on the chart, that explains all the mechanics and strategies of the indicator.

USAGE
This indicator provides clear trading strategies based on the "Support/Resistance Flip" concept.
Long Entry Strategy:
Look for an uptrend in the market.
Wait for the price to decisively break above a RED resistance box.
Observe the box's color flipping to GREEN (new support) after the breakout.
Wait for a price pullback (retest) to this newly formed GREEN support box. This area is a potential long entry signal.

Short Entry Strategy:
Look for a downtrend in the market.
Wait for the price to decisively break below a GREEN support box.
Observe the box's color flipping to RED (new resistance) after the breakdown.
Wait for a price pullback (retest) to this newly formed RED resistance box. This area is a potential short entry signal.

Note: More aggressive traders can also use the zones as direct buy or sell signals, as they represent the most tested Fibonacci levels in the past. However, this approach is riskier and requires caution. Always use it in conjunction with your own risk management strategy.
OVERVIEW
FibAlgo® - Perfect Entry Zone™ is an advanced technical analysis tool that dynamically detects and visualizes support and resistance levels in the market. Instead of static levels, it draws smart "Entry Zones" that change their color and function based on price action. The indicator's core concept is based on the principle that when a resistance level is broken, it becomes support (and vice versa). It automatically captures these "Support/Resistance Flip" moments. Its most powerful feature is the built-in "Adaptive System," or "The Brain," which analyzes historical data to find the Fibonacci levels with the highest historical accuracy and optimizes them for you.
CONCEPTS
Effective use of this indicator comes from understanding its three underlying core concepts.
1. The Adaptive Analysis Engine ("The Brain"): This is the indicator's most powerful feature. Instead of using a fixed period, it intelligently tests numerous past market peaks and troughs to find which Fibonacci range has historically produced the most accurate reversal signals. What makes this system special is its use of a weighted scoring system that prioritizes finding the "Zone 1" (the 0.0-1.0 Fibonacci range) with the highest confidence. In short, the algorithm is optimized to find the most reliable initial reversal areas for you.
2. Dynamic Zones and the S/R Flip (Support/Resistance Flip): The colored boxes you see on the chart represent the dynamic battle between support and resistance. Their colors and states change according to price action.
Uptrend Scenario: As a trend begins, a RED box appears as potential resistance. If the price breaks through this red box to the upside, the trend's strength is confirmed, and the indicator flips the box's color to GREEN. This means the old resistance has now become new support. This new green box is now a potential LONG entry area on a price retest.
Downtrend Scenario: As a trend begins, a GREEN box appears as potential support. If the price breaks down through this green box, the trend's strength is validated, and the indicator flips the box's color to RED. This shows that the old support has now become new resistance. This new red box is now a potential SHORT entry area on a price retest.
3. Confidence Percentage (% Confidence): This percentage, displayed on each box, is a data-driven score that shows the historical significance of that price zone. It answers the question: "In the past, how often did the market react to this specific price area?" A higher percentage suggests the zone is more significant and noteworthy.
FEATURES
Intelligent Adaptive System ("The Brain"): A smart engine that automatically finds and optimizes the most suitable Fibonacci analysis period for the market.
Dynamic Support/Resistance Flip Zones: Visually intuitive entry zones that automatically change function and color (from red to green or green to red) based on price breakouts.
Data-Driven Confidence Score: A confidence rating that displays the historical importance and success rate of each zone as a percentage, aiding in decision-making.
Automatic Fibonacci Drawing: Automatically detects significant peaks and troughs (pivots) in the market and draws the relevant Fibonacci structure for you.
Comprehensive Visual Customization: The ability to adjust many visual elements to your personal preference, including trend lines, level lines, colors, label positions, and font sizes.
Built-in User Guide: A detailed user manual, viewable on the chart, that explains all the mechanics and strategies of the indicator.
USAGE
This indicator provides clear trading strategies based on the "Support/Resistance Flip" concept.
Long Entry Strategy:
Look for an uptrend in the market.
Wait for the price to decisively break above a RED resistance box.
Observe the box's color flipping to GREEN (new support) after the breakout.
Wait for a price pullback (retest) to this newly formed GREEN support box. This area is a potential long entry signal.
Short Entry Strategy:
Look for a downtrend in the market.
Wait for the price to decisively break below a GREEN support box.
Observe the box's color flipping to RED (new resistance) after the breakdown.
Wait for a price pullback (retest) to this newly formed RED resistance box. This area is a potential short entry signal.
Note: More aggressive traders can also use the zones as direct buy or sell signals, as they represent the most tested Fibonacci levels in the past. However, this approach is riskier and requires caution. Always use it in conjunction with your own risk management strategy.
發行說明
FibAlgo® Just Got a Major Brain Upgrade!We're thrilled to announce a significant update to the FibAlgo® - Perfect Entry Zone™ indicator! This isn't just a minor tweak; we've rebuilt core parts of the engine to make it smarter, faster, and more adaptable to your personal trading style.
Here’s what’s new for you:
1. A More Versatile Trading Brain
The "Adaptive System" is the heart of FibAlgo®, and we've given it a massive upgrade. You can now choose from four distinct Fibonacci Analysis Sets, effectively giving the indicator's brain a different "personality" to match your strategy:
Comprehensive Analytical: The classic, deep-analysis mode you know and love.
Advanced Harmonic: Perfect for traders who focus on harmonic patterns like Gartleys and Bats.
Standard Trend: A streamlined set for classic trend-following strategies.
Universal Standard: Focuses on the most common and universally respected Fibonacci levels.
By choosing a set, you're telling the algorithm to prioritize the levels that are most important to your style of trading, resulting in zones that are more tailored to you.
2. A Smarter, More Proactive Engine
Previously, the adaptive engine would find the best historical settings based on the market's current trend. Now, it's far more intelligent. The new engine is constantly calculating the optimal settings for both bullish and bearish scenarios simultaneously.
This means that no matter which way the market turns, FibAlgo® is already prepared with the most historically accurate data, leading to more robust and reliable "Perfect Entry Zones."
3. Supercharged Performance
Say goodbye to lag! We've completely re-engineered how the indicator performs its complex calculations. The heavy lifting is now done only when a new, significant market swing is confirmed. The result? The indicator is now dramatically lighter, faster, and smoother on your charts, ensuring you get instant updates without a performance hit.
4. Instant Insights on Your Chart
You can now instantly see the exact Fibonacci value of every important market pivot. A new option allows you to display a small label (e.g., "PH: 0.618") at each swing high or low. This gives you immediate feedback on market structure and helps you see precisely which levels are being respected.
We're incredibly excited about these improvements and believe they will make the FibAlgo® indicator an even more powerful tool in your trading arsenal.
Happy trading!
僅限邀請腳本
只有經作者批准的使用者才能訪問此腳本。您需要申請並獲得使用權限。該權限通常在付款後授予。如欲了解更多詳情,請依照以下作者的說明操作,或直接聯絡FibAlgo。
除非您完全信任其作者並了解腳本的工作原理,否則TradingView不建議您付費或使用腳本。您也可以在我們的社群腳本中找到免費的開源替代方案。
作者的說明
🚨Get premium: FibAlgo.com
❓Do you have feedback or indicator ideas? Feel free to email us for feedback -> support@fibalgo.com
提醒:在請求訪問權限之前,請閱讀僅限邀請腳本指南。
免責聲明
這些資訊和出版物並不意味著也不構成TradingView提供或認可的金融、投資、交易或其他類型的意見或建議。請在使用條款閱讀更多資訊。