OPEN-SOURCE SCRIPT
已更新 Last xHL
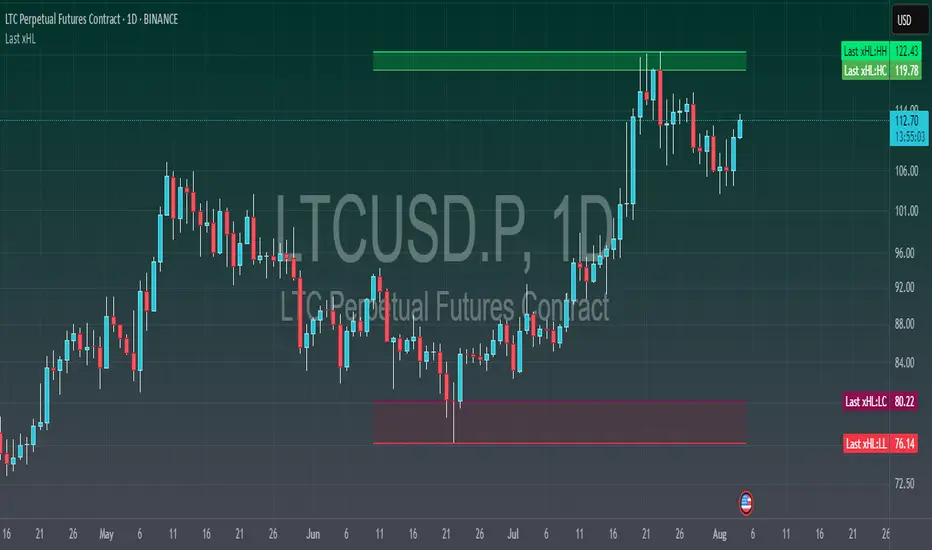
📈 Last xHL – Visualize Key Highs and Lows
This script highlights the most recent significant highs and lows over a user-defined period, helping traders quickly identify key support and resistance zones.
🔍 Features:
⚙️ Customization:
🧠 Use Case:
This tool is ideal for traders who want to:
This script highlights the most recent significant highs and lows over a user-defined period, helping traders quickly identify key support and resistance zones.
🔍 Features:
- Highest High (HH) and Highest Close/Open (HC) lines
- Lowest Low (LL) and Lowest Close/Open (LC) lines
- Dynamic updates with each new bar
- Gradient-filled zones between HH–HC and LL–LC for visual clarity
⚙️ Customization:
- Adjustable lookback period (_length) to suit your trading style
- Color-coded lines and fills for quick interpretation
🧠 Use Case:
This tool is ideal for traders who want to:
- Spot potential breakout or reversal zones
- Identify price compression or expansion areas
- Enhance their technical analysis with visual cues
This script is for educational and informational purposes only. It does not constitute financial advice. Always do your own research before making trading decisions.
發行說明
✅ New Feature:The values of HH, HC, LL, and LC are now also plotted invisibly to appear in the Data Window and on the Price Scale, allowing for easier reference and analysis without cluttering the chart.
開源腳本
秉持TradingView一貫精神,這個腳本的創作者將其設為開源,以便交易者檢視並驗證其功能。向作者致敬!您可以免費使用此腳本,但請注意,重新發佈代碼需遵守我們的社群規範。
Show your piety to your god. World needs your humanity.
免責聲明
這些資訊和出版物並非旨在提供,也不構成TradingView提供或認可的任何形式的財務、投資、交易或其他類型的建議或推薦。請閱讀使用條款以了解更多資訊。
開源腳本
秉持TradingView一貫精神,這個腳本的創作者將其設為開源,以便交易者檢視並驗證其功能。向作者致敬!您可以免費使用此腳本,但請注意,重新發佈代碼需遵守我們的社群規範。
Show your piety to your god. World needs your humanity.
免責聲明
這些資訊和出版物並非旨在提供,也不構成TradingView提供或認可的任何形式的財務、投資、交易或其他類型的建議或推薦。請閱讀使用條款以了解更多資訊。