OPEN-SOURCE SCRIPT
small channel in 5min
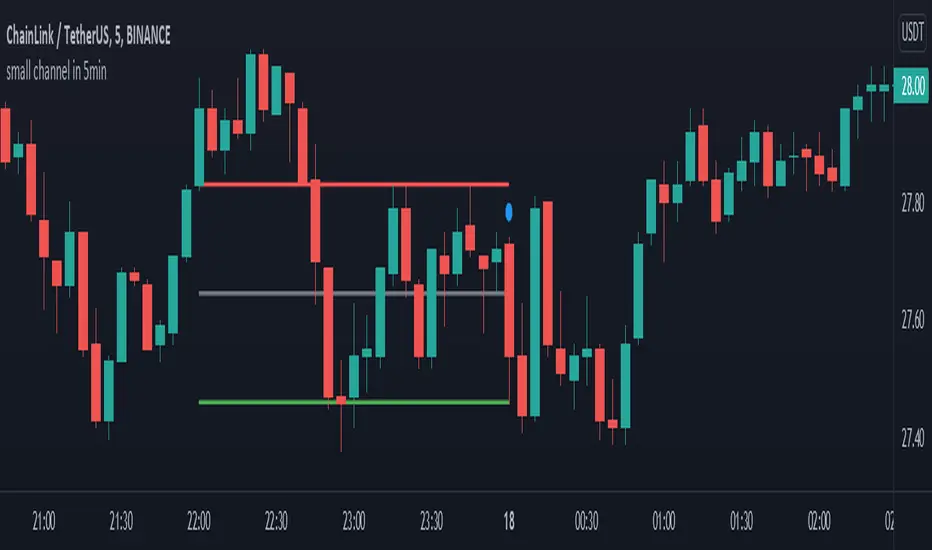
This indicator designed for 5min time-frame.
it detects a candlestick pattern in one hour time-frame and draw a channel based on the detected pattern, where two candles [0] and [1] are covered by the third one [2], in 5 min time-frame.
the bottom, middle and top of the channel are colored by green, gray and red respectively. this channel may help user to use it as a possible support and resistance region.
(the pattern is defined in line 11 to 13.)
enjoy it
開源腳本
秉持TradingView一貫精神,這個腳本的創作者將其設為開源,以便交易者檢視並驗證其功能。向作者致敬!您可以免費使用此腳本,但請注意,重新發佈代碼需遵守我們的社群規範。
免責聲明
這些資訊和出版物並非旨在提供,也不構成TradingView提供或認可的任何形式的財務、投資、交易或其他類型的建議或推薦。請閱讀使用條款以了解更多資訊。
開源腳本
秉持TradingView一貫精神,這個腳本的創作者將其設為開源,以便交易者檢視並驗證其功能。向作者致敬!您可以免費使用此腳本,但請注意,重新發佈代碼需遵守我們的社群規範。
免責聲明
這些資訊和出版物並非旨在提供,也不構成TradingView提供或認可的任何形式的財務、投資、交易或其他類型的建議或推薦。請閱讀使用條款以了解更多資訊。